

The model introduced in this study used a system dynamics method with social life cycle assessment. Also, we considered geometallurgical approach integrated with processing routes analysis for the material flow analysis. Using system dynamics modeling43, we quantified the mass flow analysis and key social indices in mining and processing of materials required by green energy technologies as well as manufacturing of equipment used by those technologies, such as wind turbines, electric vehicles (EVs), lithium-ion batteries (LiBs), and solar photovoltaic panels (PVs). We quantified the key social indices of the related critical materials, i.e., This should be corrected as follows:Rare Earth Elements (REEs), Nickel (Ni), Silicon (Si), Graphite, Magnesium (Mg), Gallium (Ga), Germanium (Ge), Indium (In), Aluminum (Al), Cobalt (Co), Lithium (Li), Zinc (Zn), and Tellurium (Te). We conducted an uncertainty analysis to examine the validity of the designed model. The results showed at least 97% compatibility of simulation model results with real-world data. This included REE mining and production of the solar PVs. Details on the analysis can be found in Supplementary Data 1.
The analysis of the social impact of supply chains starts by identifying the related stakeholders. Lifecycle stakeholders are entities for which social consequences are most likely to occur44. In this study, the analysis follows the cradle-to-gate approach, where the system boundary covers the extraction of raw materials until the manufactured energy technologies are produced and ready to be utilized. In this study, the workers stakeholder corresponds to the group of individuals engaged in direct economic activities along the supply chain. The local communities stakeholder corresponds to the group of people residing or living in a common location and sharing the same geographical locations where the supply chain processes occur45.
Each stage of the supply chain reflects a hotspot where certain social issues are most likely to materialize. The impact of these issues affects relevant stakeholders46. Unlike the other types of assessments, e.g., environmental assessments, social assessment in this study covers positive and negative social impact categories (Table 1).
This study proposes a dynamics model covering regional flows of critical materials covered by the study and their use in the manufacturing of analyzed green technologies. The model consists of 1182 variables and parameters. The main variables, including flow, stock and auxiliary variables, are presented in Supplementary Table 2; parameters and all data required to run the model are available in Supplementary Table 2 and Supplementary Data. To specify model boundaries (Supplementary Fig. 1), we divided the variables of the dynamic model into two groups, including endogenous and exogenous variables. Endogenous variables affect and, at the same time, are affected by other system components and parameters, while exogenous variables are not directly affected by the system. Groups and types of all variables are presented in Supplementary Table 2 and 3. The dynamic assessment of the social indicators is dependent on the three main factors: (1) geographical location (country or region where the processes take place), (2) life cycle stage (mining, processing, and manufacturing), and (3) the technology processed in addition to the related critical energy materials needed (Fig. 5). The analysis covers social assessment of all stages of the supply chain. We assessed the manufacturing stage for six technologies, i.e., wind turbines, solar PVs, LiBs, battery EVs, hybrid EVs, and plug-in hybrid EVs.
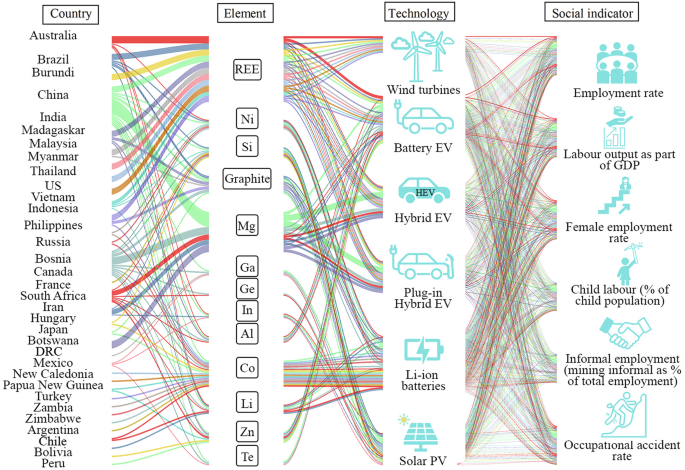
The diagram illustrates the flow of materials from extraction in top producer countries, through their use in technologies, and onward to their social impacts. This comprehensive overview helps show how materials move through these systems and where they are concentrated to discover opportunities to manage materials sustainably.
Stocks and flows are the foundations of system dynamics modeling (Supplementary Eqs. 1 and 2). Stock (i.e., stock of material or energy) corresponds to an entity that accumulates or drains over time, as shown in Eq. (1).
$${\bf{S}}\left({\rm{t}}\right)={{\int _{{{\rm{t}}}_{0}}^{{{\rm{t}}}}}} \left[{\bf{I}}\left({\rm{t}}\right)-{\bf{O}}\left({\rm{t}}\right)\right]{\rm{dt}}+{\bf{S}}({{\rm{t}}}_{0})$$
(1)
where, \({\rm{S}}({\rm{t}})\) is the amount of material accumulated at time \({\rm{t}}\); \({\rm{I}}({\rm{t}})\) and \({\rm{O}}\left({\rm{t}}\right)\) are calculated using Eq. (2). \({\rm{I}}({\rm{t}})\) is the amount of material input to \({\rm{S}}\left({\rm{t}}\right)\) at time \({\rm{t}}\); \({\rm{O}}\left({\rm{t}}\right)\) is the amount of material output from \({\rm{S}}\left({\rm{t}}\right)\) at time \({\rm{t}}\); and \({\rm{S}}({{\rm{t}}}_{0})\) is the amount of material accumulated at the initial time \({{\rm{t}}}_{0}\).
$$\begin{array}{c}{\bf{I}}\left({\rm{t}}\right)={\bf{f}}\left({\bf{S}}\left({\rm{t}}\right),{\bf{V}}\left({\rm{t}}\right),{\bf{P}}\right);\\ {\bf{O}}\left({\rm{t}}\right)={\bf{f}}\left({\bf{S}}\left({\rm{t}}\right),{\bf{V}}\left({\rm{t}}\right),{\bf{P}}\right)\end{array}$$
(2)
where \({\rm{V}}({\rm{t}})\) is an auxiliary variable (i.e., it is not directly affected by the system components) at time \({\rm{t}}\), e.g., the supply flow of materials depends on the available amount of resources and production capacity; \({\rm{P}}\) is a parameter of the system, e.g., processing coefficient of energy materials to manufacturing stage.
Social life cycle assessment consists of impact categories and sub-categories of social dimension which we explain separately.
Gender equality
Equal rights are crucial for sustainable development and economic growth47, which aligns with SDG 518. Female employment reflects the importance of female participation in economic life and the significance of gender equality in practice. Equal opportunities for both male and female in participating in economic activities demonstrate a strong base for gender equality. In this study, female employment rates are considered as the indicator assessing gender equality levels in the critical energy materials supply chain. Equation (3) refers to the mathematical formulation of the female employment \(({{\rm{F}}}_{{\rm{x}},{\rm{i}},{\rm{j}}}\left({\rm{t}}\right))\):
$${{\bf{F}}}_{{\rm{x}},{\rm{i}},{\rm{j}}}\left({\rm{t}}\right)=\frac{\,{{\bf{f}}}_{{\rm{x}},{\rm{i}},{\rm{j}}}\left({\rm{t}}\right)\times {{\bf{r}}}_{{\rm{x}}.{\rm{i}}.{\rm{j}}}\left({\rm{t}}\right)\,}{{{\bf{Lf}}}_{{\rm{j}}}({\rm{t}})}\times 100$$
(3)
where \({{\rm{f}}}_{{\rm{x}},{\rm{i}},{\rm{j}}}\left({\rm{t}}\right)\) is the number of female employees required to produce one-tonne output at stage \({\rm{x}}=1,\,2,\,3\) (mining, processing and product manufacturing) of element \({\rm{i}}=1,\,2,\,3,\,\ldots,\,13\) (REEs, Ni, Si, graphite, Mg, Ga, Ge, In, Al, Co, Li, Zn, and Te) in country \({\rm{j}}=1,\,2,\,3,\,\ldots,\,33\) (Australia, Brazil, Burundi, China, India, Madagascar, Malaysia, Myanmar, Thailand, US, Vietnam, Indonesia, Philippines, Russia, Bosnia, Canada, France, South Africa, Iran, Hungary, Japan, Botswana, Democratic Republic of Congo (DRC), Mexico, New Caledonia, Papua New Guinea, Turkey, Zambia, Zimbabwe, Argentina, Chile, Bolivia, and Peru) in year \({\rm{t}}\) of the period 2010–2030; \({{\rm{r}}}_{{\rm{x}},{\rm{i}},{\rm{j}}}\left({\rm{t}}\right)\) is the mass flow (tonne) of output at stage \({\rm{x}}\) of element \({\rm{i}}\), in country \({\rm{j}}\); and \({{\rm{Lf}}}_{{\rm{j}}}\left({\rm{t}}\right)\) is the female labor force variable. For the purpose of our study, the term ‘labor force’ means active individuals who fulfill the requirements and are able and willing to be employed48.
Informal employment
Informal employment corresponds to any type of employment that is neither taxed nor monitored by government authorities. It leads to the absence of any environmental or health security for workers and the absence of any rule that would require mandatory certifications and licenses before starting the work49. The eradication of informal employment is essential to promote the creation of decent jobs (8.3.1 SDG target) and to include the working groups in the social protection system (1.3.1 SDG target)18. Informal employment often leads to a lack of social protection for workers (i.e., inability to ensure decent living conditions for the whole population throughout their lives), including access to benefits such as health care, unemployment insurance, and retirement savings. This work assesses the number of employees working informally along the energy materials supply chain model. The mathematical formulation to measure the informal employment levels \(({{\rm{I}}}_{{\rm{x}},{\rm{i}},{\rm{j}}}\left({\rm{t}}\right))\) is presented by Eq. (4).
$${{\bf{I}}}_{{\rm{x}},{\rm{i}},{\rm{j}}}\left({\rm{t}}\right)=\frac{{{\bf{i}}}_{{\rm{x}},{\rm{i}},{\rm{j}}}\left({\rm{t}}\right)\times {{\bf{e}}}_{{\rm{x}},{\rm{i}},{\rm{j}}}\left({\rm{t}}\right)\times {{\bf{r}}}_{{\rm{x}},{\rm{i}},{\rm{j}}}\left({\rm{t}}\right)}{{{\bf{T}}}_{{\rm{j}}}({\rm{t}})}\times 100$$
(4)
where \({{\rm{i}}}_{{\rm{x}},{\rm{i}},{\rm{j}}}\left({\rm{t}}\right)\) is the proportion of informal employment at stage \({\rm{x}}=1,\,2,\,3\) of element \({\rm{i}}=1,\,2,\,3,\,\ldots,\,13\) in country \({\rm{j}}=1,\,2,\,3,\,\ldots,\,33\) in year \({\rm{t}}\) of the period 2010–2030; \({{\rm{e}}}_{{\rm{x}},{\rm{i}},{\rm{j}}}\left({\rm{t}}\right)\) is the number of employees required to produce one tonne of output at stage \({\rm{x;}}\) \({{\rm{r}}}_{{\rm{x}},{\rm{i}},{\rm{j}}}\left({\rm{t}}\right)\) is the mass flow (tonne) of output at stage \({\rm{x}}\), of element \({\rm{i}}\), in country \({\rm{j}}\); and \({{\rm{T}}}_{{\rm{j}}}({\rm{t}})\) is the total employment.
Labor income share
The labor income share has always attracted little attention due to its stability (i.e., with minimum fluctuation over time). A low share of labor income might directly affect several areas, including the purchasing power, household consumption, exports, and government consumption50. This social indicator addresses the economic contribution to the region’s GDP to achieve the 8.5 target of the SDG addressing decent work with equal pay18. This study considers the total labor income share via the critical energy materials supply chain as part of the GDP (Eq. (5)):
$${{\bf{L}}}_{{\rm{x}},{\rm{i}},{\rm{j}}}\left({\rm{t}}\right)=\frac{{{\bf{K}}}_{{\rm{x}},{\rm{i}},{\rm{j}}}\left({\rm{t}}\right)\times {{\bf{e}}}_{{\rm{x}},{\rm{i}},{\rm{j}}}\left({\rm{t}}\right){\times {\bf{r}}}_{{\rm{x}},{\rm{i}},{\rm{j}}}\left({\rm{t}}\right)}{{{\bf{GDP}}}_{{\rm{j}}}({\rm{t}})}\times 100$$
(5)
where \({{\rm{K}}}_{{\rm{x}},{\rm{i}},{\rm{j}}}\left({\rm{t}}\right)\) is the annual salary earned per employee at stage \({\rm{x}}=1,\,2,\,3\) of element \({\rm{i}}=1,\,2,\,3,\,\ldots,\,13\) in country \({\rm{j}}=1,2,\,3,\,\ldots,\,33\); \({{\rm{e}}}_{{\rm{x}},{\rm{i}},{\rm{j}}}\left({\rm{t}}\right)\) is the number of employees required to produce one tonne of output at stage \({\rm{x}}\), of element \({\rm{i}}\), in country \({\rm{j}}\); and \({{\rm{GDP}}}_{{\rm{j}}}({\rm{t}})\) is the national gross domestic production in year \({\rm{t}}\) of the period 2010–2030.
Employment rate
Employment plays a significant role in strengthening social and economic autonomy as well as social well-being51. Its importance is highlighted as a powerful tool to achieve the SDG target 8.3 of promoting policies to support job creation and growth of enterprises. Communities are the primary target of enhancing local employment rates. In this work, employment refers to individuals within a working age group who are actively engaged in economic activities for pay or profit. The employment rates consider labor employment via the critical energy materials supply chain. The employment rate \(({{\rm{E}}}_{{\rm{x}}}\left({\rm{t}}\right))\) is calculated by Eq. (6).
$${{\bf{E}}}_{{\rm{x}},{\rm{i}},{\rm{j}}}\left({\rm{t}}\right)=\frac{{{\bf{e}}}_{{\rm{x}},{\rm{i}},{\rm{j}}}\left({\rm{t}}\right)\times {{\bf{r}}}_{{\rm{x}},{\rm{i}},{\rm{j}}}\left({\rm{t}}\right)}{{{\bf{Lb}}}_{{\rm{j}}}({\rm{t}})}\times 100$$
(6)
where \({{\rm{e}}}_{{\rm{x}}}\left({\rm{t}}\right)\) is the number of employees required to produce one tonne of output at stage \({\rm{x}}=1,\,2,\,3\) of element \({\rm{i}}=1,\,2,\,3,\,\ldots,\,13\) in country \({\rm{j}}=1,\,2,\,3,\,\ldots,\,33\) in year \({\rm{t}}\) of the period 2010–2030; \({{\rm{r}}}_{{\rm{x}},{\rm{i}},{\rm{j}}}\left({\rm{t}}\right)\) is the mass flow (tonne) of output at stage \({\rm{x}}\), of element \({\rm{i}}\), in country \({\rm{j}}\); and \({{\rm{Lb}}}_{{\rm{j}}}({\rm{t}})\) is the workforce variable.
Child labor
Eradication of child labor has become a major target to promote a decent work environment52. Around 150 million children (aged <15) are engaged in economic activities53. Despite the decreasing trend of child labor in the past decade, the trend has slowed down18. This indicator addresses the 8.7.1 target among the list of SDGs for eradicating child labor18. This study considers the child labor issue along the energy materials supply chain processes. The number of children engaged in child labor \(({{\rm{C}}}_{{\rm{x}}}\left({\rm{t}}\right))\) is calculated according to Eq. (7).
$${{\bf{C}}}_{{\rm{x}},{\rm{i}},{\rm{j}}}\left({\rm{t}}\right)=\frac{{{\bf{cw}}}_{{\rm{x}},{\rm{i}},{\rm{j}}}\left({\rm{t}}\right)\times {{\bf{r}}}_{{\rm{x}},{\rm{i}},{\rm{j}}}\left({\rm{t}}\right)\times {{\bf{e}}}_{{\rm{x}},{\rm{i}},{\rm{j}}}\left({\rm{t}}\right)}{{{\bf{Ch}}}_{{\rm{j}}}({\rm{t}})}\times 100$$
(7)
Where \({{\rm{cw}}}_{{\rm{x}},{\rm{i}},{\rm{j}}}\left({\rm{t}}\right)\) is the number of children engaged per one worker at stage \({\rm{x}}=1,\,2,\,3\) of element \({\rm{i}}=1,\,2,\,3,\,\ldots,\,13\) in country \({\rm{j}}=1,2,\,3,\,\ldots,\,33\) in year \({\rm{t}}\) of the period 2010–2030; \({{\rm{e}}}_{{\rm{x}}}\left({\rm{t}}\right)\) is the number of employees required to produce one tonne of output at stage \({\rm{x}}\) of element \({\rm{i}}\) in country \({\rm{j}}\); \({{\rm{r}}}_{{\rm{x}},{\rm{i}},{\rm{j}}}\left({\rm{t}}\right)\) is the mass flow of materials at stage \({\rm{x}}\), of element \({\rm{i}}\), in country \({\rm{j}}\); and \({{\rm{Ch}}}_{{\rm{j}}}({\rm{t}})\) is the child population variable.
Work safety
Minimizing occupational accidents in supply chain activities is a prominent factor in ensuring a healthy and safe working environment. It is one of the targets associated with SDG 8 designed to sustain economic growth, i.e., target 8.8.1 (putting an end to occupational injuries)54. This work measures occupational accidents associated with the manufacturing stage, i.e., manufacturing of wind turbines, solar PV panels, batteries, and EVs. Equation (8) refers to the calculation needed to quantify occupational accidents, \(({{\rm{A}}}_{{\rm{x}}}\left({\rm{t}}\right))\).
$${{\bf{A}}}_{{\rm{l}}}\left({\rm{t}}\right)={{\bf{a}}}_{{\rm{l}}}\left({\rm{t}}\right)\times {{\bf{r}}}_{{\rm{l}}}\left({\rm{t}}\right)$$
(8)
Where \({{\rm{a}}}_{{\rm{l}}}\left({\rm{t}}\right)\) is the number of accidents occurring after producing one-tonne output \({\rm{l}}=1,\,2,\,3,\,4,\,5,\,6\,\)(wind turbines, solar PV panels, NiMH and Li-ion batteries, battery EVs, plug-in EVs, and plug-in hybrid EVs) in year \({\rm{t}}\) of the period 2010–2030; and \({{\rm{r}}}_{{\rm{l}}}\left({\rm{t}}\right)\) is the amount flow (tonnes) of output \({\rm{l}}=1,\,2,\,3,\,4,\,5,\,6\).
Reporting summary
Further information on research design is available in the Nature Portfolio Reporting Summary linked to this article.