

Gold price 2025: A year of two halves
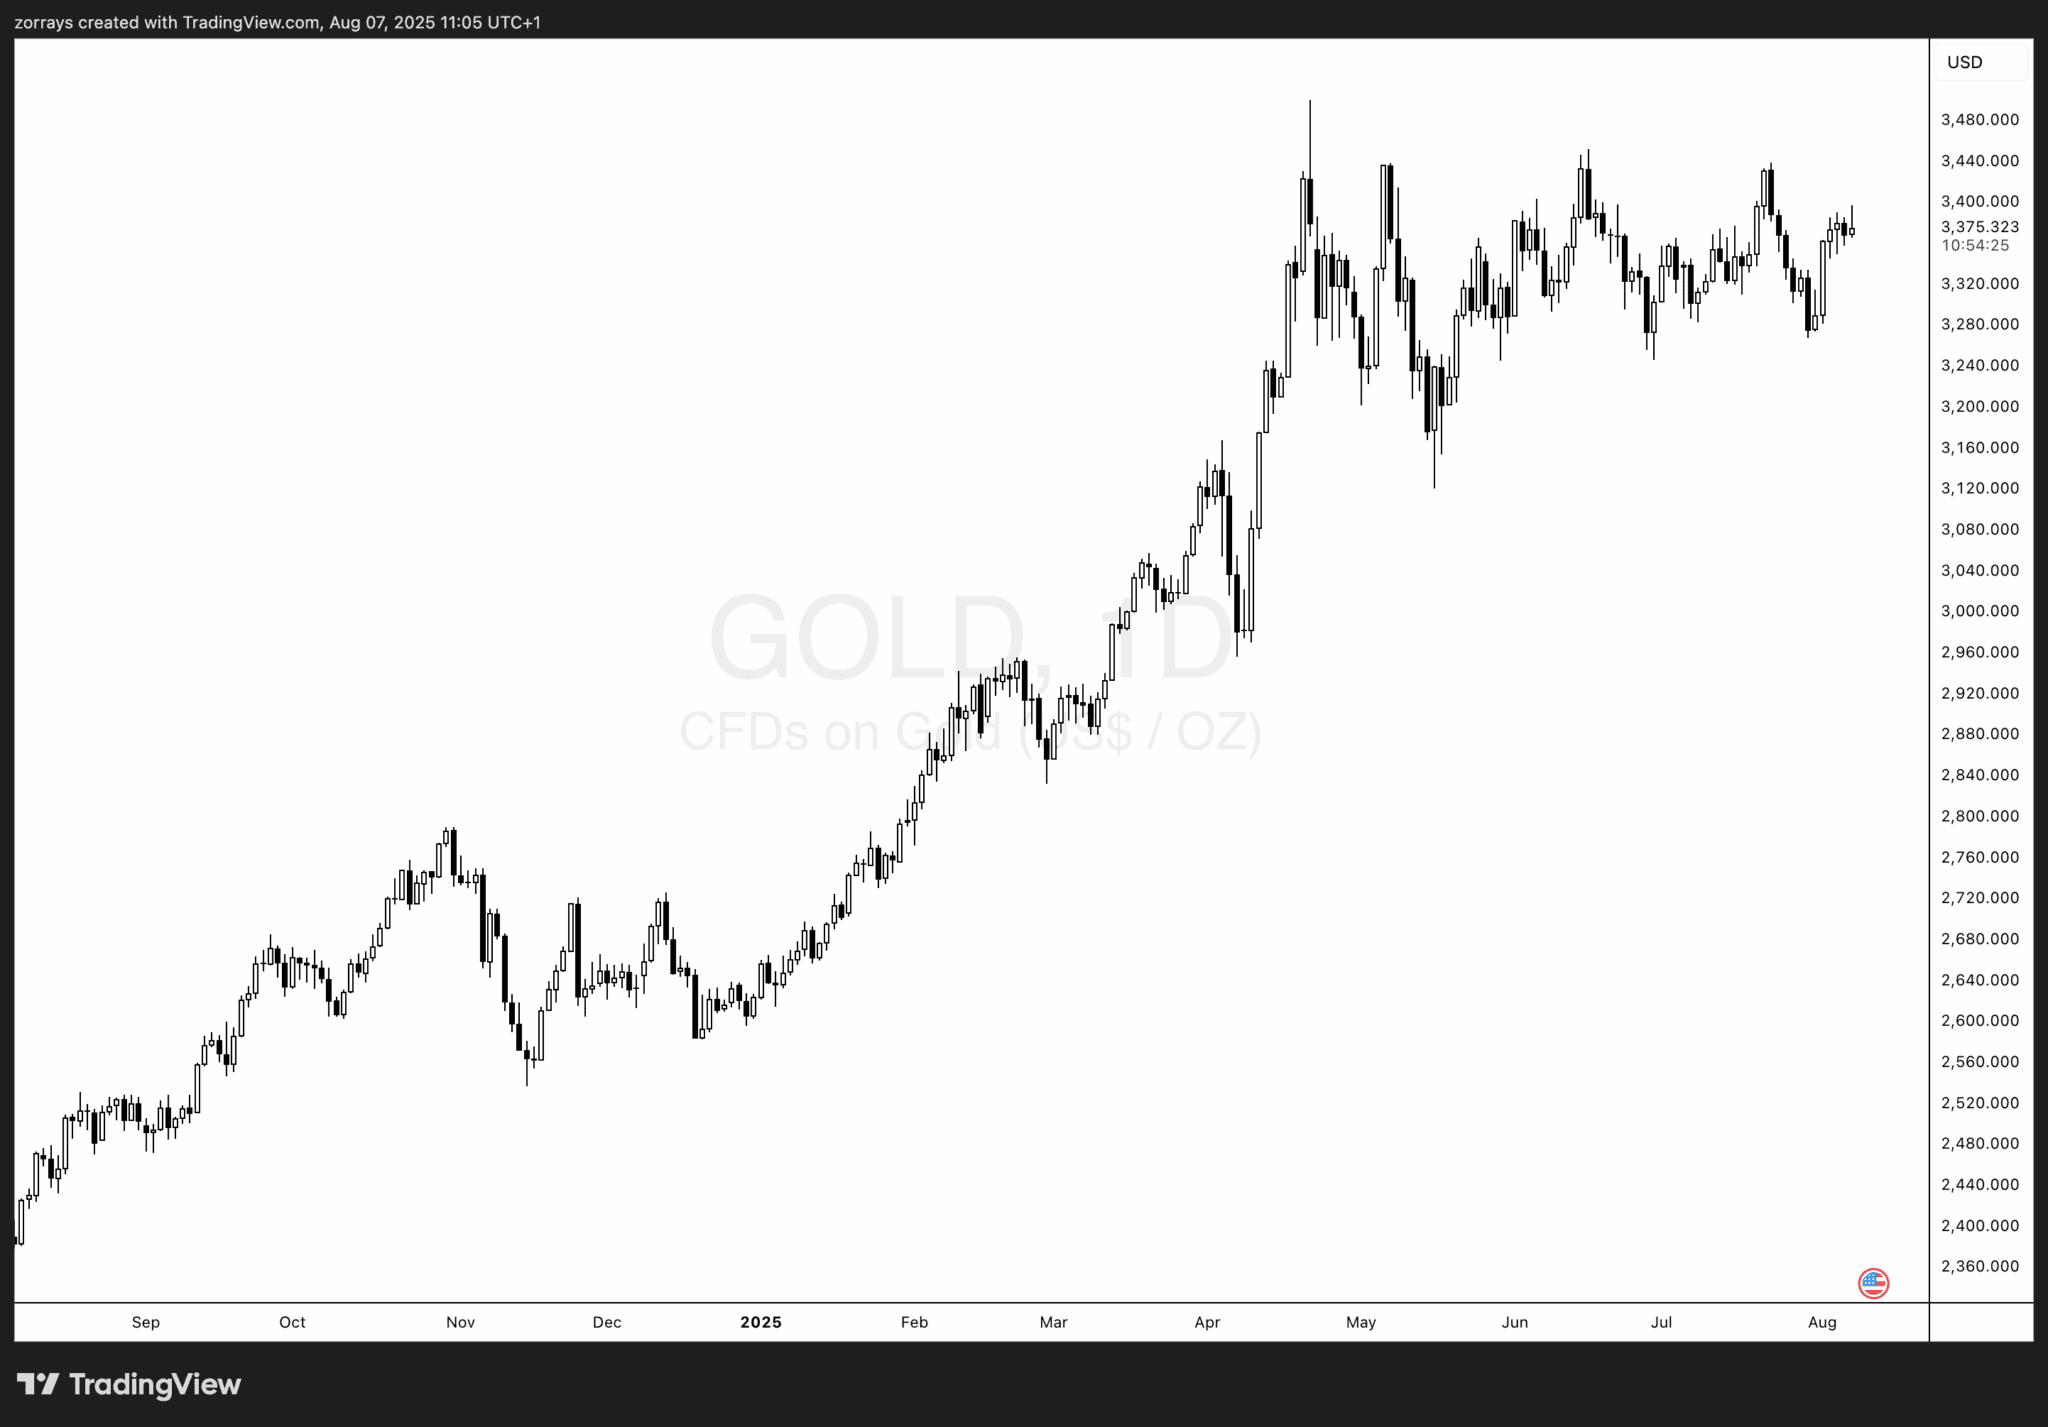
Gold soared past $3,500/oz in April 2025, marking an all-time high. However, the momentum has cooled since, with price action locked in a narrow range just below those highs.
- Most of the gains occurred in Q1 and early Q2.
- Since April, price has oscillated tightly between $3,300–$3,500.
- A breakout above $3,440/oz is now the key resistance to watch (more on this in the technicals below).
Despite the sideways movement, gold has maintained strong support amid growing macroeconomic uncertainty.
Fed rate cuts on the horizon: A tailwind for Gold
Gold doesn’t yield interest — but that’s exactly what gives it an edge when interest rates fall.
- The market is currently pricing in a 93% probability of a Fed rate cut at the next FOMC meeting.
- The catalyst? A weak jobs report:
-
- July payrolls: Only 73,000 jobs added.
- Previous month revised down by ~260,000.
- Trump’s response was swift — firing the head of the agency hours after the release.
What’s driving the dovish shift?
- US inflation is cooling.
- GDP growth is slowing.
- The Fed may now embark on three rate cuts in 2025 and two more in early 2026 — a steeper path than markets currently expect.
Political pressure
- Fed independence is in question again.
- Governor Adriana Kugler’s resignation opens the door for a Trump-aligned appointment.
- Powell’s term ends May 2026 — markets are already bracing for potential leadership changes.
Bottom line: Lower interest rates = bullish gold.
Central banks still hoarding Gold
Central banks remain net buyers of gold, using it as a hedge against fiat volatility and geopolitical risk.
Key stats from Q2 2025 (world Gold council):
- Central banks added 166 tonnes of gold.
- Top buyers:
-
- National Bank of Poland: 19 tonnes (now holds 515 tonnes or 22% of total reserves).
- Central Bank of Uzbekistan: 9 tonnes in June alone.
- China’s central bank continues its buying spree:
-
- July 2025 marked the ninth straight month of gold purchases.
- Total gold reserves now sit at 73.96 million troy ounces.
Although 2Q buying was 33% lower than 1Q, the continued accumulation signals enduring demand — especially in countries looking to reduce reliance on the US dollar.
ETF inflows signal strong investor appetite
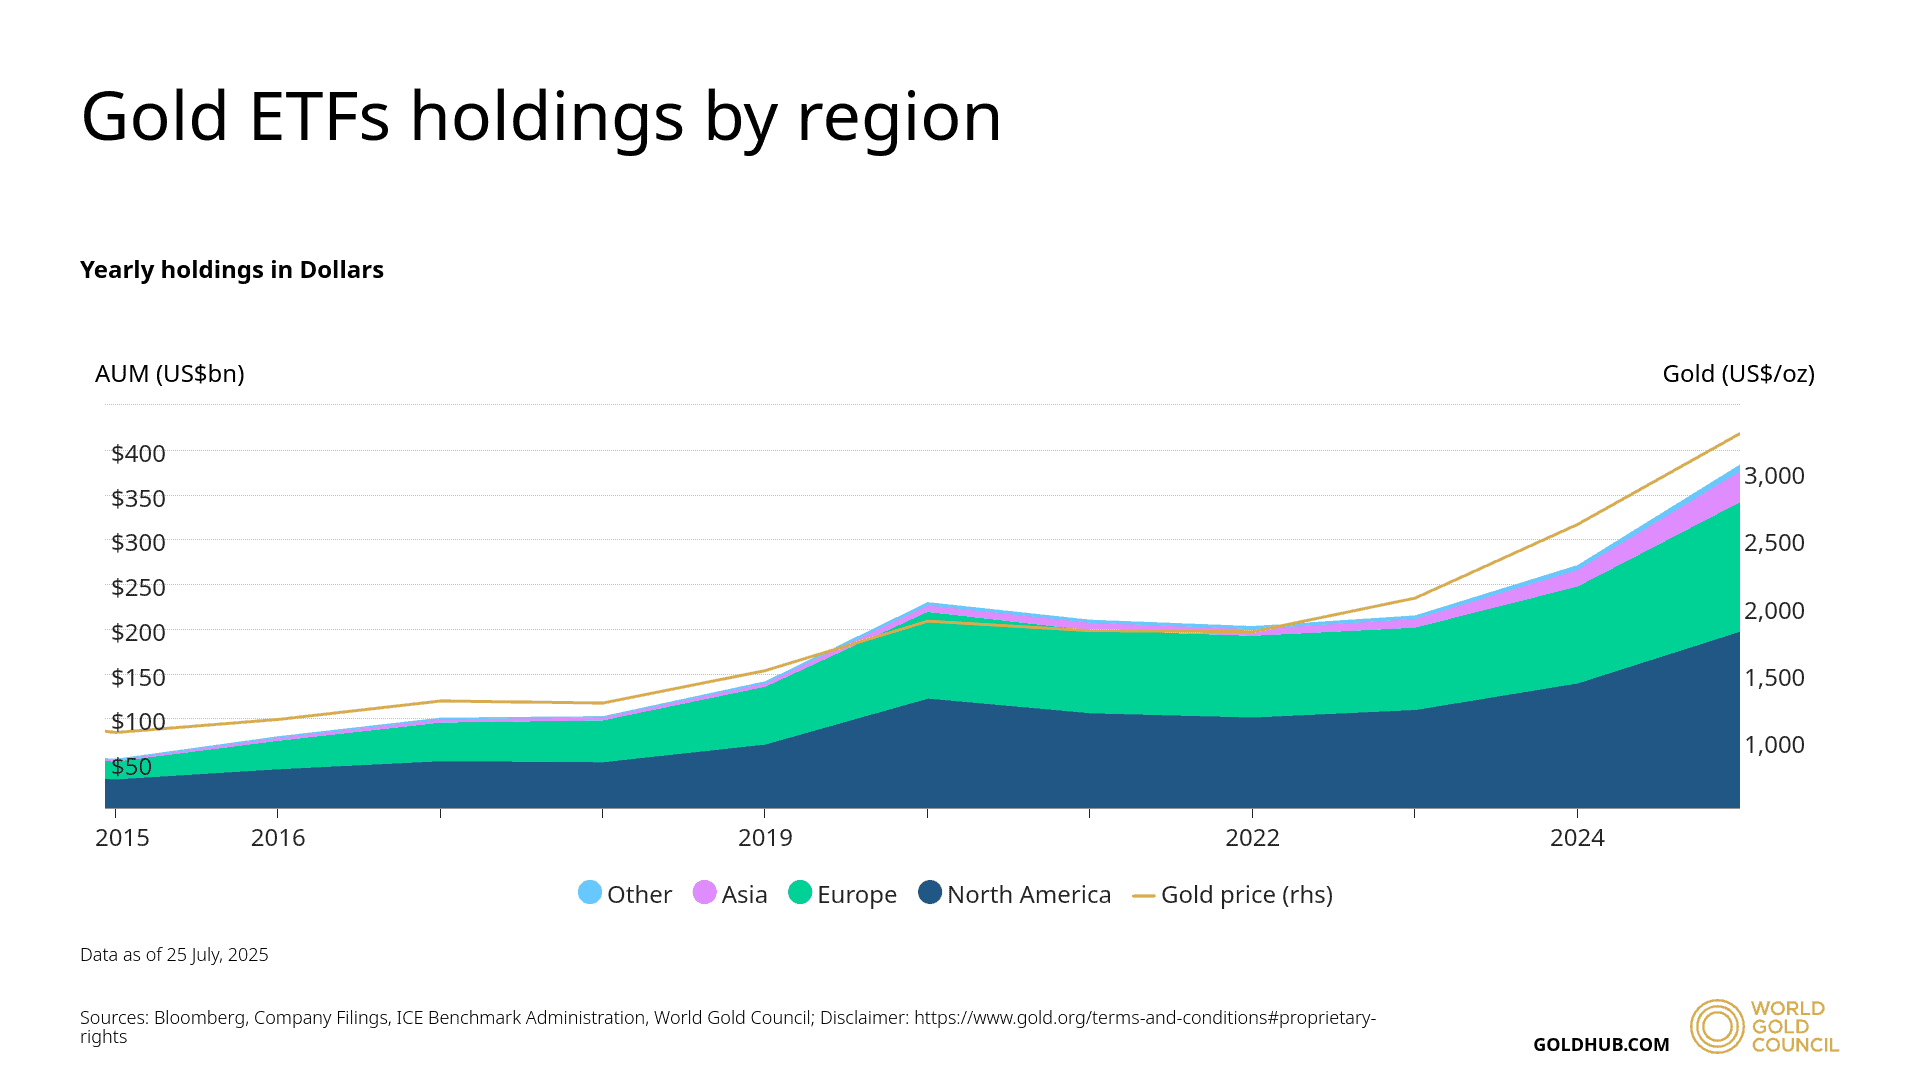
Gold-backed ETFs have roared back in 2025, seeing 397 tonnes of net inflows in the first half of the year.
- Q1 2025: 227 tonnes
- Q2 2025: 170 tonnes
-
- April and June led the charge, outweighing a slight May dip.
Regional breakdown:
- North America and Europe remain the biggest holders.
- Asia and “Other” regions are gradually increasing participation.
- Assets under management (AUM) are trending toward $400 billion, still slightly below the 2020 peak.
This surge reflects investor demand for inflation protection, geopolitical hedges, and portfolio diversification.
China’s Gold reserves: A strategic accumulation
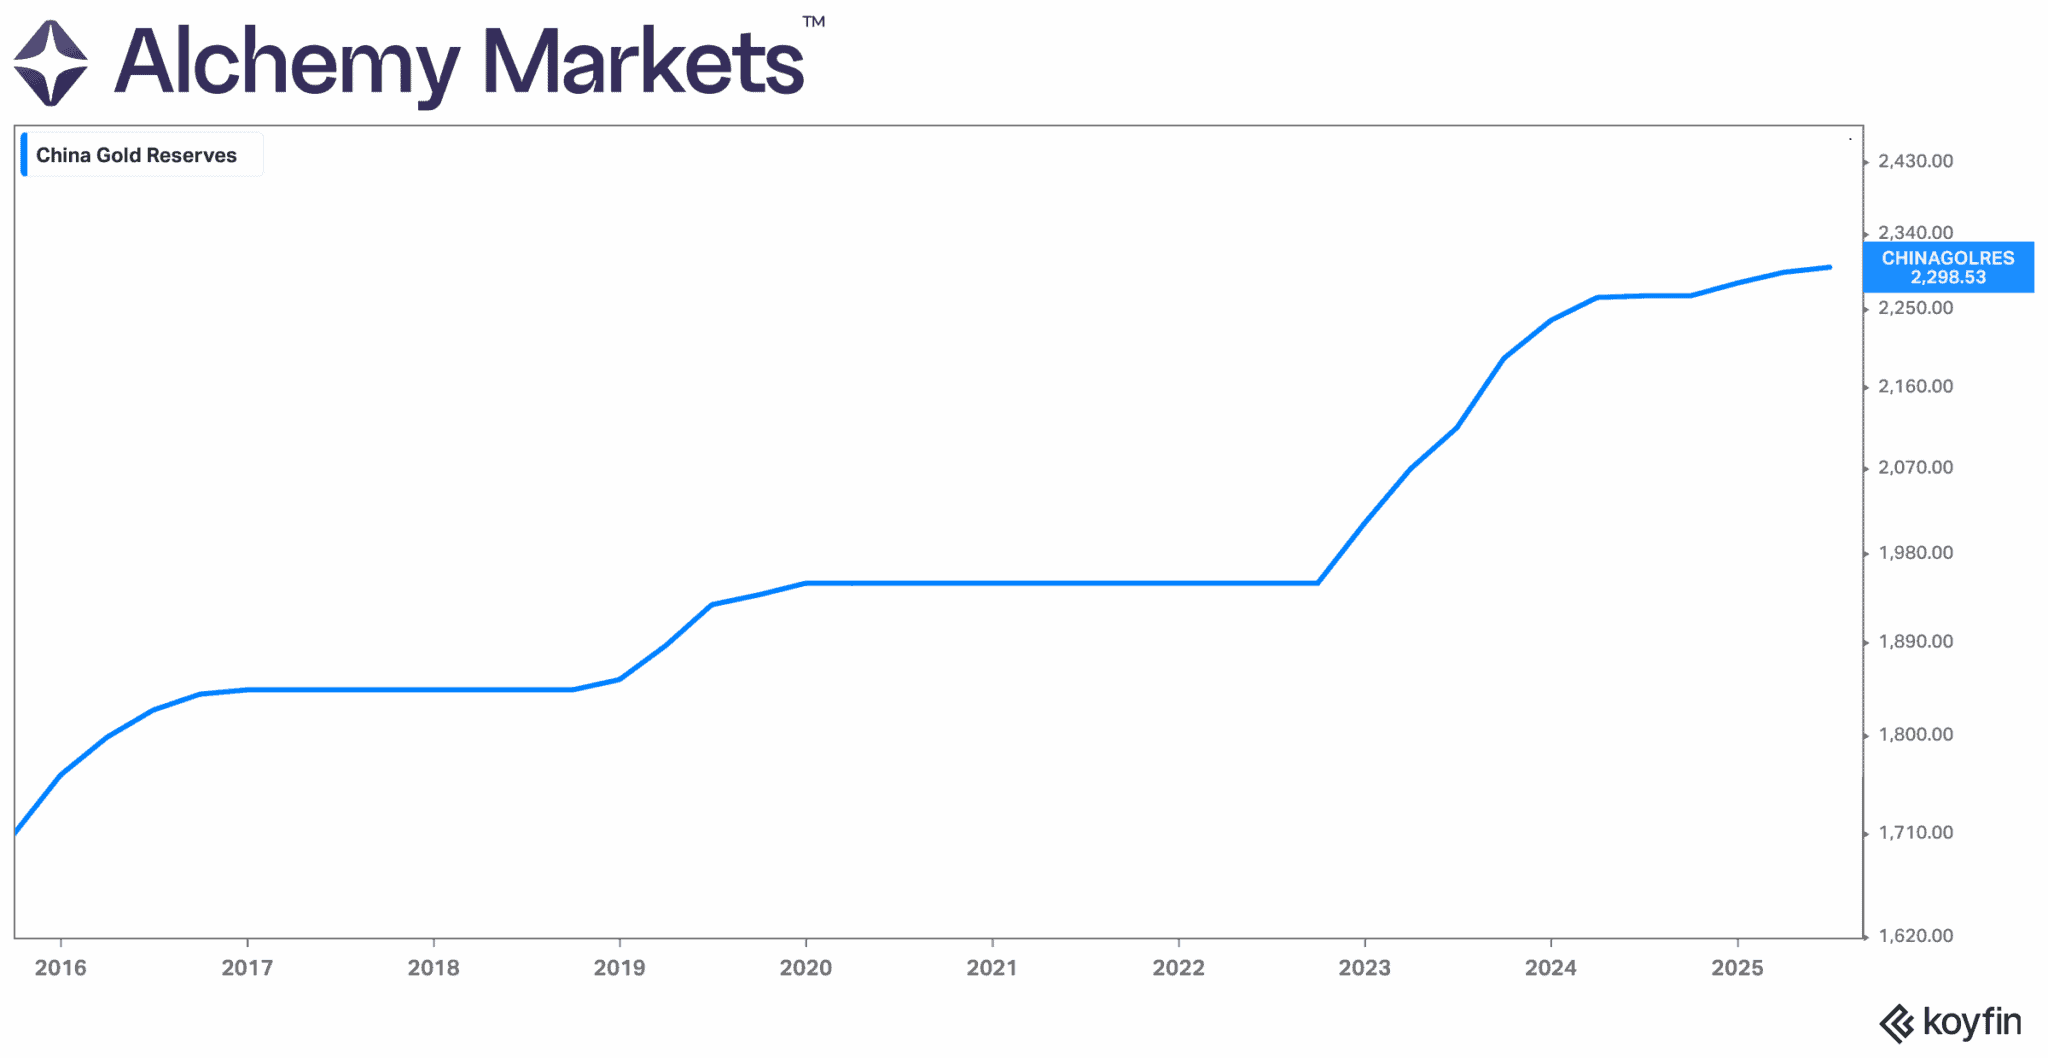
China continues to be a standout buyer among central banks.
- July’s addition of 60,000 troy ounces brings the total tally since November 2024 to ~36 tonnes.
- China’s gold reserves have grown from just over 1,600 tonnes in 2015 to over 2,300 tonnes in 2025, as shown in the latest Alchemy Markets data.
This move aligns with China’s long-standing strategy to reduce exposure to the USD and boost financial independence.
Technical picture: A triangle is almost complete
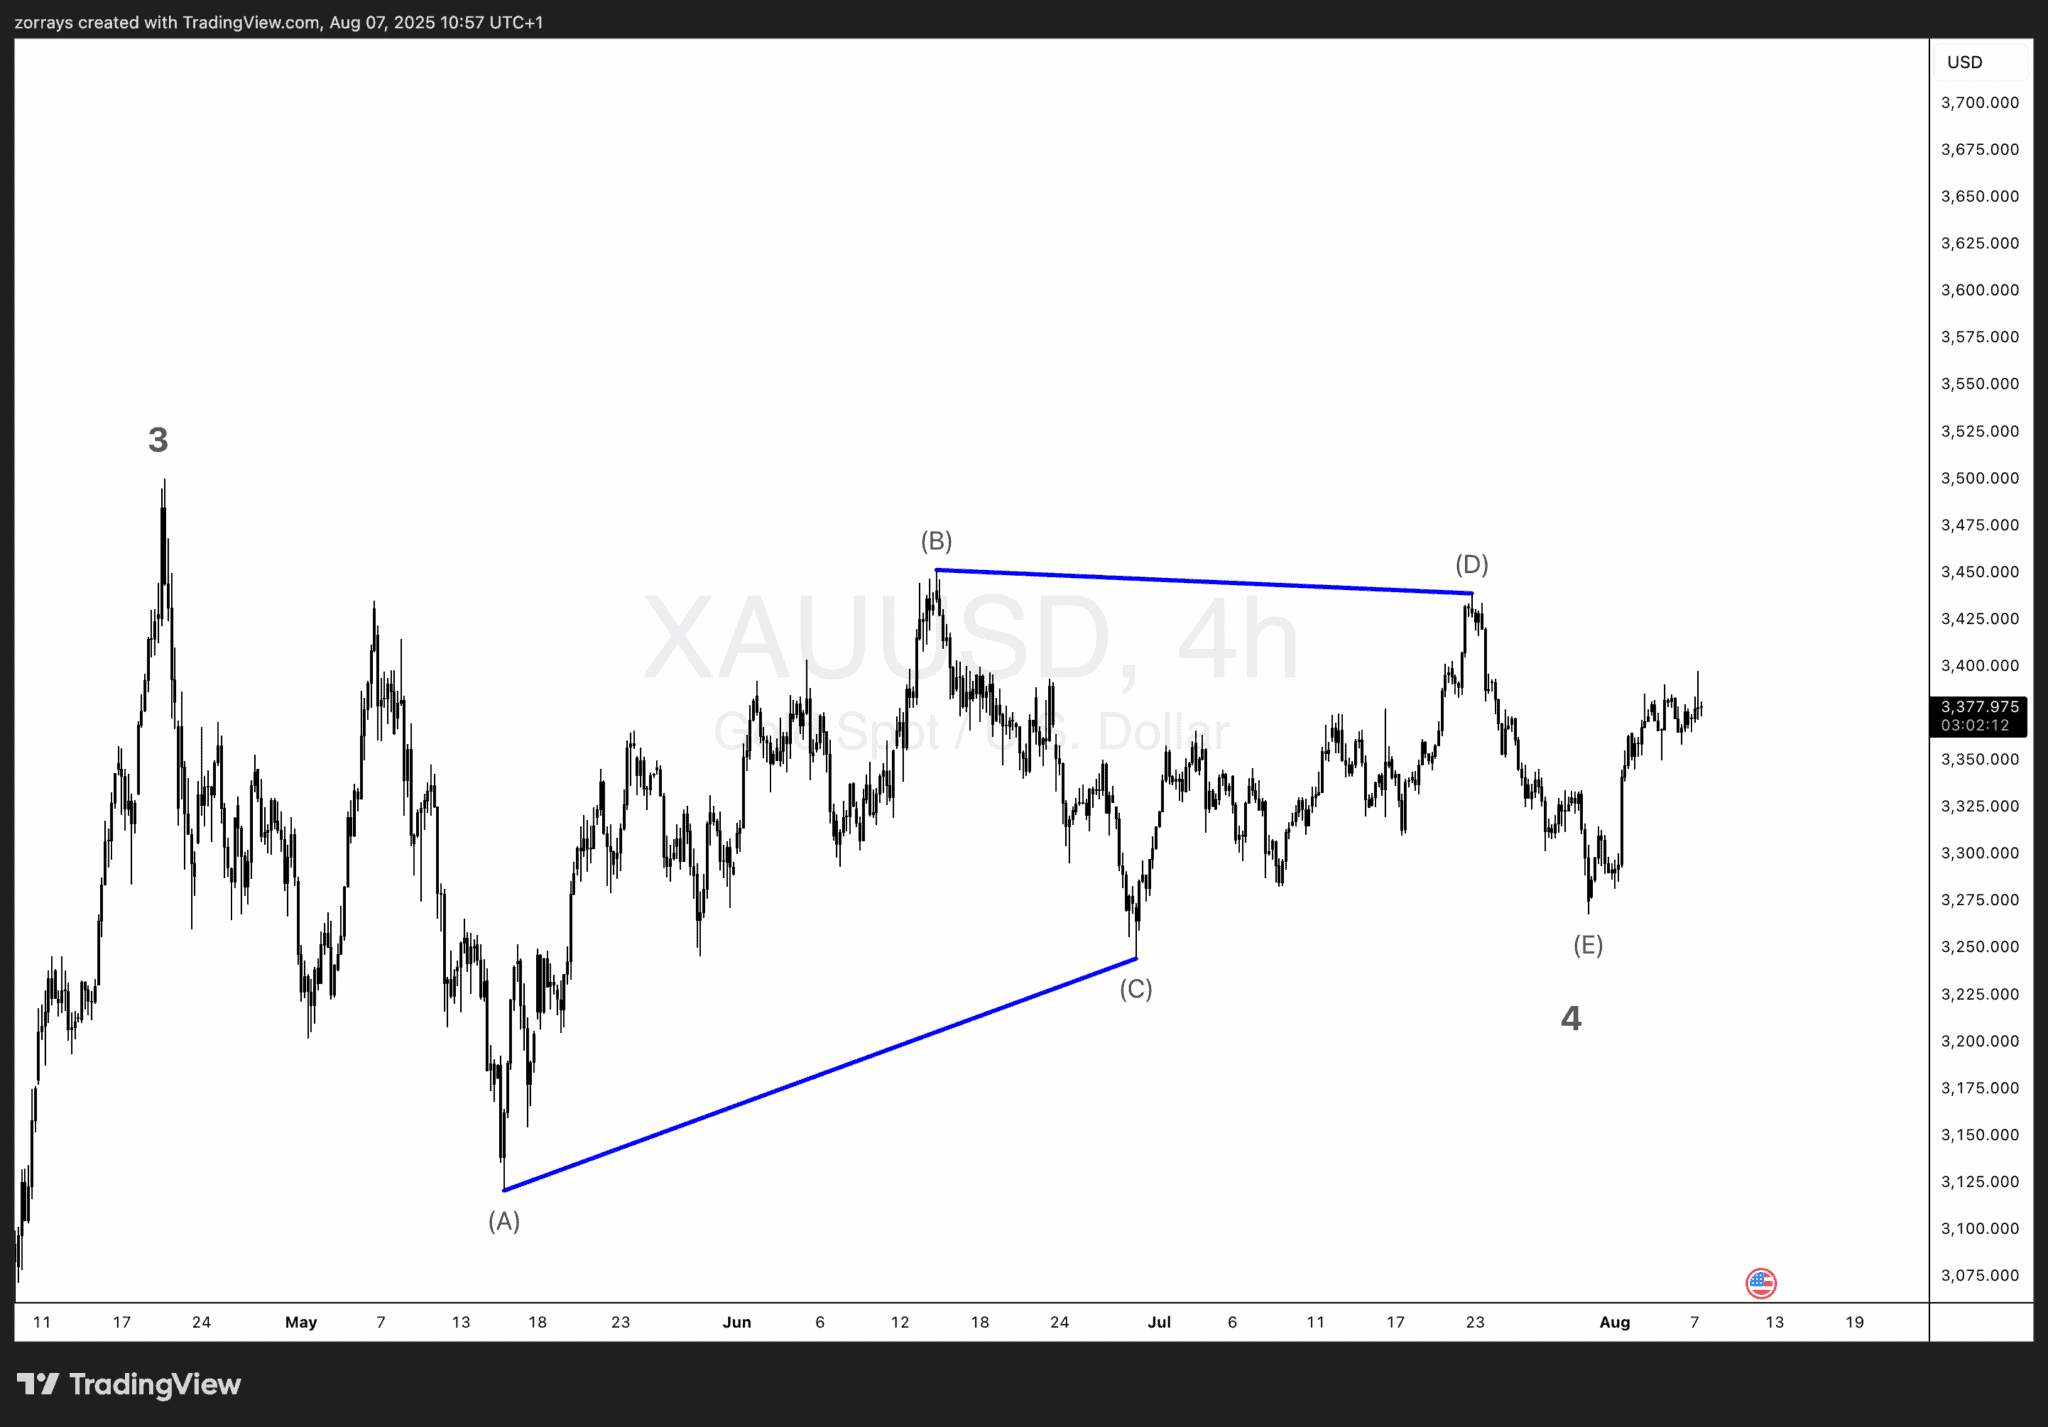
The chart tells a story — and it’s one of potential breakout.
Since June 2025, gold has been carving out a contracting Elliott Wave based triangle pattern on the 4-hour chart. The current wave structure suggests that Wave E of the triangle is now complete.
Triangle structure:
- Wave A: Late May bottom.
- Wave B: June spike to ~$3,470.
- Wave C: Higher low in early July.
- Wave D: Retest of upper boundary near $3,450.
- Wave E: Final low around $3,250.
Key technical level:
- A clean break above $3,440/oz would confirm the breakout and likely launch the next impulsive rally toward $3,600+.
7. Macro meets momentum: Why Gold isn’t done yet
When you zoom out, multiple factors are aligning in gold’s favor:
- Fed rate cuts imminent
- Central banks still accumulating
- ETFs seeing renewed demand
- China reinforcing its reserves
- Technical breakout potentially unfolding
All signs point to continued support for gold — and perhaps another leg higher into record territory.
Forecast: Average price of $3,600/oz by year-end looks increasingly achievable.
Conclusion: The Gold narrative remains strong
Gold has taken a breather since April, but don’t mistake consolidation for weakness. In fact, this might just be the calm before another bullish storm.
With:
- Strong macro tailwinds,
- Central bank backing,
- Retail and institutional demand rising,
- And a bullish technical setup…
Gold remains one of the most compelling assets on the global stage right now.
FAQs
Q1: Why is gold trading sideways after hitting record highs?
Because it is consolidating after a strong rally. Investors are awaiting fresh catalysts, like rate cuts or geopolitical developments.
Q2: What could push gold to new highs this year?
Rate cuts by the Fed, continued central bank buying, and a breakout above $3,440/oz on the charts.
Q3: Are ETFs a good signal for gold strength?
Yes. Rising ETF inflows often reflect increasing investor confidence in the metal.
Q4: What’s China’s role in the gold market?
China’s consistent accumulation highlights its intent to reduce USD exposure and strengthen monetary independence.
Q5: Is gold still a good inflation hedge in 2025?
Absolutely. Even as inflation moderates, uncertainty and rate cuts boost gold’s relative attractiveness.
Q6: What does the triangle pattern suggest for gold?
It suggests gold is near the end of a consolidation phase. A breakout above $3,440/oz would likely signal the start of a new rally wave.