

Gold continues to navigate a delicate balance as global macroeconomic dynamics evolve. Optimism surrounding the ongoing U.S.–China talks has lent support to the precious metal, although many traders are treading carefully ahead of any concrete outcomes. Meanwhile, China’s central bank has extended its gold accumulation streak into a seventh consecutive month, offering a layer of structural support to the market. Yet, as silver surges to 13-year highs and the gold-silver ratio declines, liquidity appears to be shifting—raising the question: is silver quietly taking the lead in the precious metals trade?
Market and macro news (Impact on Gold)
- US–China talks remain in focus: optimism supports gold, though cautious traders step back before outcomes.
- China purchasing gold: central bank buying for the 7th month adds structural support.
- Silver at 13-year highs, gold-silver ratio tumbled → liquidity shifting into silver.
Gold (XAU/USD)
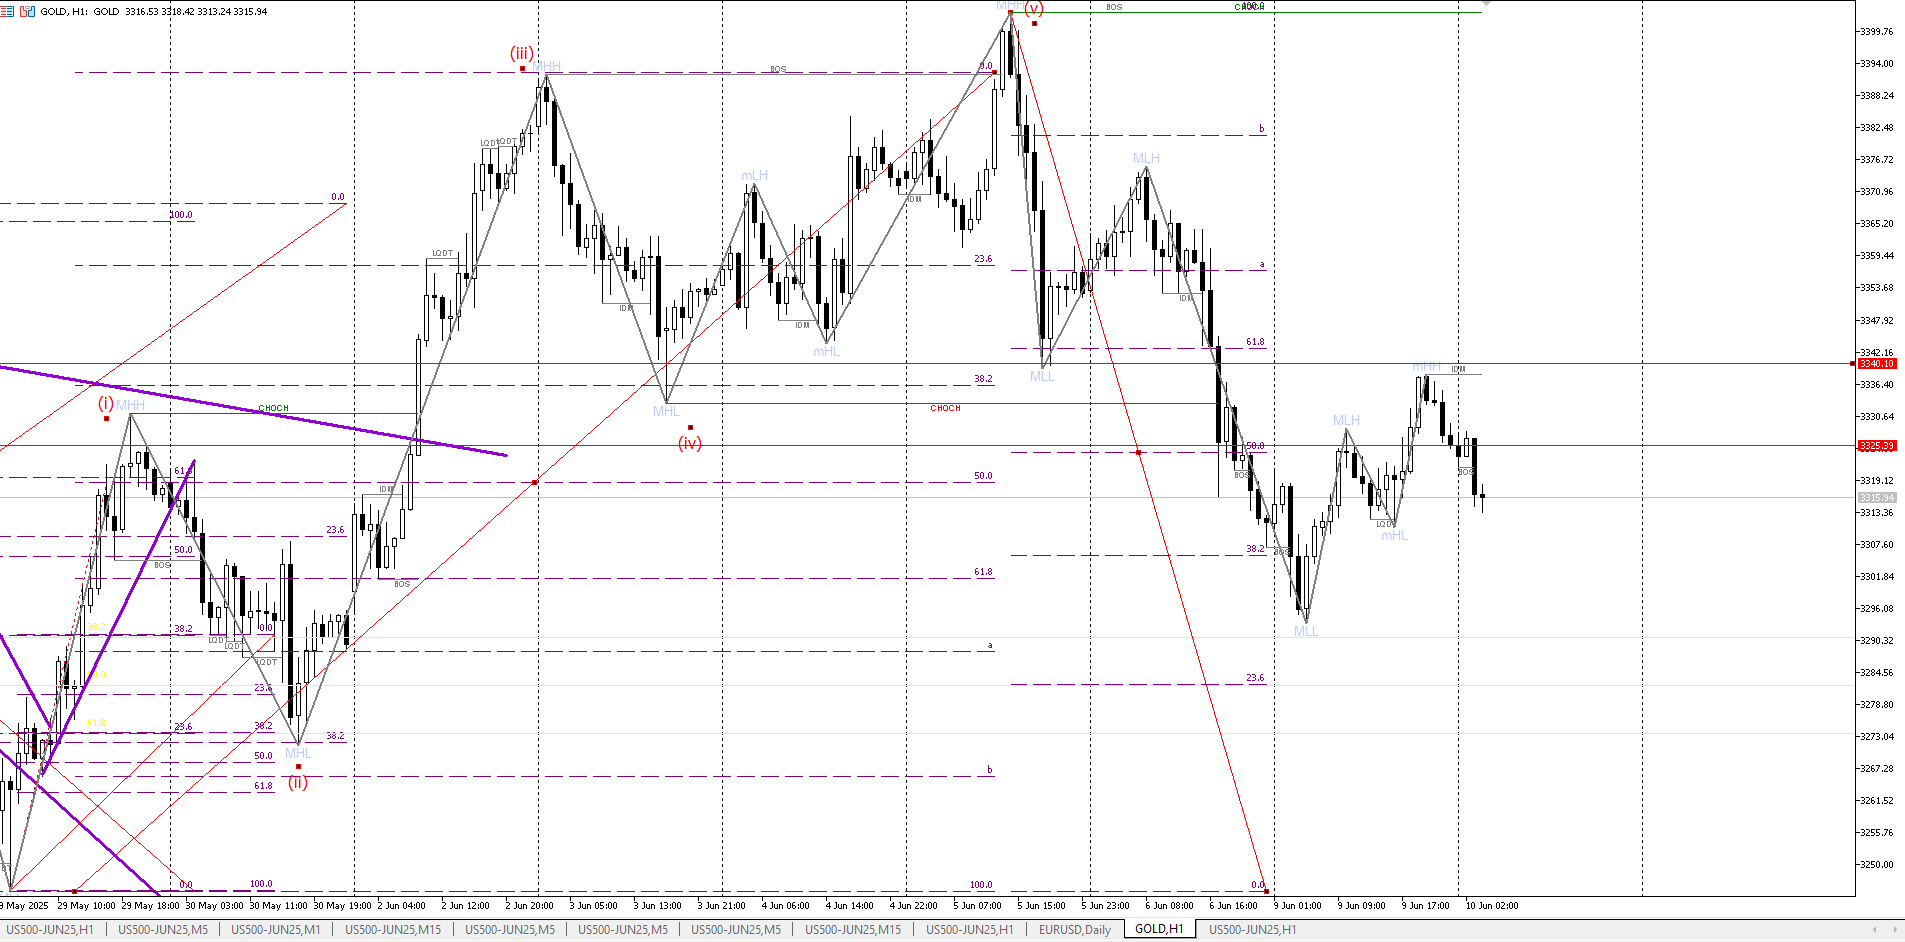
Wave Count (Elliott) Wave (i) and (ii) are completed, forming the base structure.
- A strong impulsive rally unfolds into Wave (iii), culminating at the local Major Higher High (MHH).
- After a corrective decline into Wave (iv) with higher low (mHL), market pushed into Wave (v), completing a classic 5-wave impulse.
- The peak of Wave (v) created a new MHH and broke structure, triggering BOS (Break of Structure).
- The subsequent retracement confirms a Change of Character (CHoCH), initiating a corrective A-B-C decline still waiting for market to unfold
- June 6 (PM) fix: $3,356.05, down from $3,385.60 on June 5
- This fix is a global benchmark, set twice daily (10:30 AM & 3 PM London time), balancing institutional buy/sell orders ( April vault holdings in London rose ~0.6% to 8,536 tonnes as US-sourced bullion returned, normalizing premiums
Astro & Gann signature
- Venus in Taurus reinforces gold’s appeal (Venus rules metals and Taurus is its own sign)
- Mercury conjunct Jupiter and nearing full Moon in Gemini suggest volatility spikes and possible trend reversals
COT (Commitments of traders) flow
- Hedgers (commercials) increased shorts by ~16,600 contracts.
- Speculators added ~12,900 net long positions; total non-commercial net rose to ~188k contracts
Hedgers position for potential pullback; speculators remain bullish, suggesting mean-reversion setups.
Silver (XAG/USD)
With silver showing strong momentum and the gold-silver ratio narrowing, traders may consider adding light silver exposure alongside their gold positions. Current spread positioning favors silver, suggesting it could continue to outperform in the near term. If the trend holds, silver prices may extend gains toward the $38–40 range, offering a compelling opportunity for diversification within precious metals portfolios
ICT structure breakdown
- MHH (Major Higher High) formed at the top of wave (v) around 3405.
- MLH (Major Lower High) appeared on the corrective bounce post-CHoCH around 3342.
- CHoCH confirmed below 3292 after the market failed to sustain structure and began forming lower lows.
Current structure
- Price is now oscillating around 3315, inside a minor consolidation.
- Rejection seen at MLH (3342.10), followed by a return toward 3292, now acting as intraday support.
- FVGs and 50%-61.8% retracements have been respected in prior legs.
Scenario 1: Bullish breakout above 3342 (MLH)
- Trigger: Hourly candle close above 3342 confirms bullish BOS.
- Plan: Do not chase breakout. Wait for price to dip back to retest 3257/62 Zone.
- This zone will act as new support, aligned with ICT “retest of CHoCH/BOS zone.”
- Buy entry: BOB (Buy one Break of 3342 with stops@3328–3342 tgt 3435 ish area
- Targets: 3430+
- Invalidation: Clean break below 3292 (intraday trend shift)
Scenario 2: Failure at MLH, bearish rejection
- If 3342 fails again and price in UK session confirms lower high below 3292, bias shifts back to bearish.
- Support zones below
o 3284.55 (yellow key fib zone)
o 3278.80 (ICT support)
o 3257.00–3265.00 (demand base and golden ratio zone)
Confluence zones
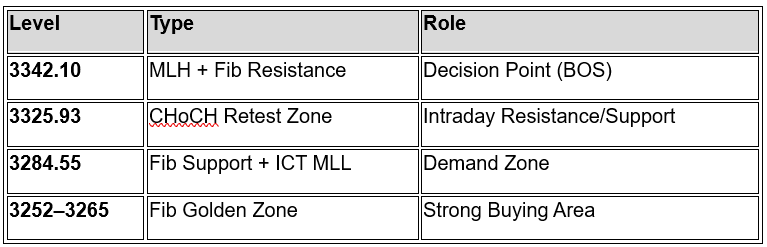
Gold’s next move hinges on the key 3342 resistance level. A breakout and retest of 3257–3262 could trigger bullish momentum toward 3430+. Failure at 3342 with a lower high below 3292 may shift bias bearish. Watch key demand zones at 3284, 3278, and 3257–3265 for potential support.