Look to 2019 to gauge if Brent can stay above $80
Declining crude-oil demand in China and increasing global-supply surpluses suggest 2025 price headwinds. Compared with conditions in 2019, Brent crude at about $77 a barrel on Jan. 7 appears elevated. The average was $64 in the year before the distortions of the pandemic, then Russia’s invasion of Ukraine. Our graphic shows a big difference: the surplus of US and Canadian supply and OPEC spare capacity exceeds imports from China, which are declining. In 2019, this supply/export measure was well below imports from Beijing.
Lower prices are a top rebalancing factor and staying above $80 is more likely to encourage greater production vs. consumption. It may take an unforeseen supply shock for crude to rise in 2025 and a top headwind could be some back-and-fill in risk assets, and Bitcoin may be a primary leading indicator.

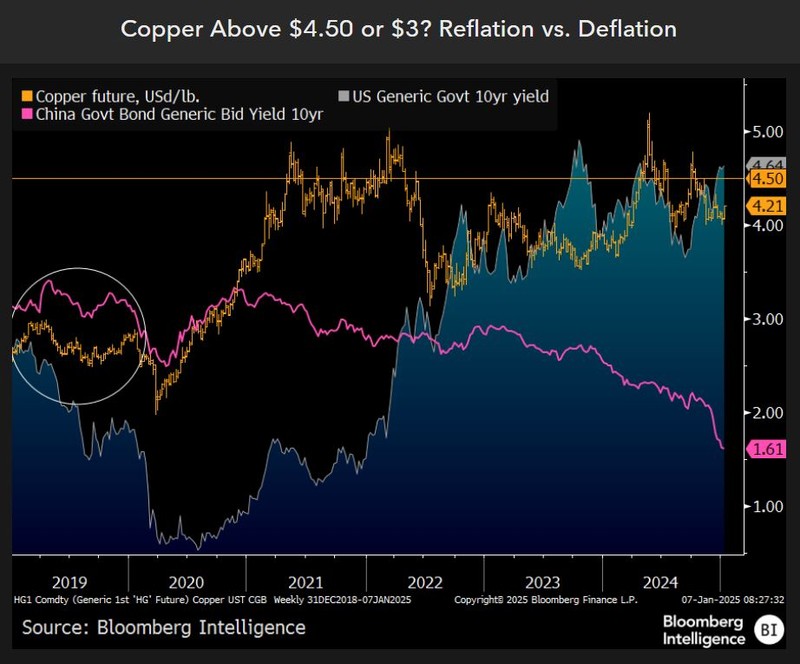
Copper’s reflation resistance at about $4.50
The per-pound price of copper on the same scale as 10-year Chinese government bonds (CGB) and US Treasury yields shows the risks of reverting toward 2019 levels. Are CGBs too low at 1.61% on Jan. 7, or US Treasuries too high around 4.70%? The metal at about $4.20 faces key resistance around $4.50. Global recovery and reflation, notably in China, would be the signal if copper can stay above this level. A more likely scenario may be to follow CGB yields and for copper to do what it normally has — revert lower.
In 2019, copper and bond yields were trending downward. The notable exception at the start of 2025 is US Treasuries. Our bias is copper could be leaning toward the average from five years ago, just below $3, rather than above $4.50, especially if the US stock market declines.

Does Bitcoin have to stay above $100,000 or else?
Never has the fate of risk assets been potentially more subject to the nuances of highly speculative so-called cryptocurrencies than in 2025. The election of former crypto antagonist turned zealot, Donald Trump, may have vaulted Bitcoin to the world’s top macroeconomic 24/7-traded leading indicator. We see a rather surprising degree of risk for global equities to start 2025, and our graphic shows the Bitcoin to S&P 500 100-day correlation at about 0.50 — the highest ever on the way up.
The benchmark crypto may need to stay above the $100,000 threshold achieved in 2024 to show risk-asset stabilization. Our bias is last years’ launch of US ETFs, Bitcoin supply cut and reelection of convert turned zealot, Trump, may be about as good as it gets for stretched speculative digital assets.

What if Bitcoin backs away from $100K?
Last year was a banner one for Bitcoin and cryptos, which may have bumped into a ceiling with implications for risk assets, gold and Treasuries. President-elect Donald Trump’s shift to crypto zealot from antagonist has raised the stakes for highly speculative digital assets to keep gaining. But what if they don’t? Risk-off assets like gold and T-bonds could be top performers if Bitcoin doesn’t stay above $100,000. The SPDR Gold Shares’ (GLD) 27% total return vs. 25% for the SPDR S&P 500 ETF in 2024 may reflect gold sniffing out some deflation.
Our graphic shows the close connection, notably since 2022, of Bitcoin and the ratio of GLD to TLT, the iShares 20+ Year Treasury Bond ETF. The GLD/TLT total return ratio has leapt to a new high around 240 from a base of 100 in 2017. If Bitcoin drops, T-bonds are poised to top gold.

Will corn stay above 2019’s $4.64 high?
Before the biggest money pump in history and Russia’s invasion of Ukraine in 2020-22, corn prices typically peaked whenever net-long speculators reached 10% of futures open interest. At this threshold as of the latest data to Jan. 3, a key question from the graphic is what might be different this time? Corn’s 2019 high of $4.64 a bushel came about when spec net-longs stretched to 10%. At about $4.50, the world’s most significant agriculture commodity appears vulnerable at the start of the new year. If corn can stay above $4.64, it would signal a potential end to the bear market.
Our bias is with the downtrend and what’s commonly required for bear-market nadirs — an enduring low-price cure. Specs may be expecting the first USDA report of 2025 on Jan. 10 to show less supply and greater demand than anticipated.


