

Silver has always been more than a metal. It stays quiet for years, but when investors start to worry about money, power, and the future, it gets loud.
When the US economy was at a crossroads and investors lost faith, silver prices went up. This has happened in the past.
Let’s rewind to the mid-1970s and check the major rallies.
US Silver Monthly Chart
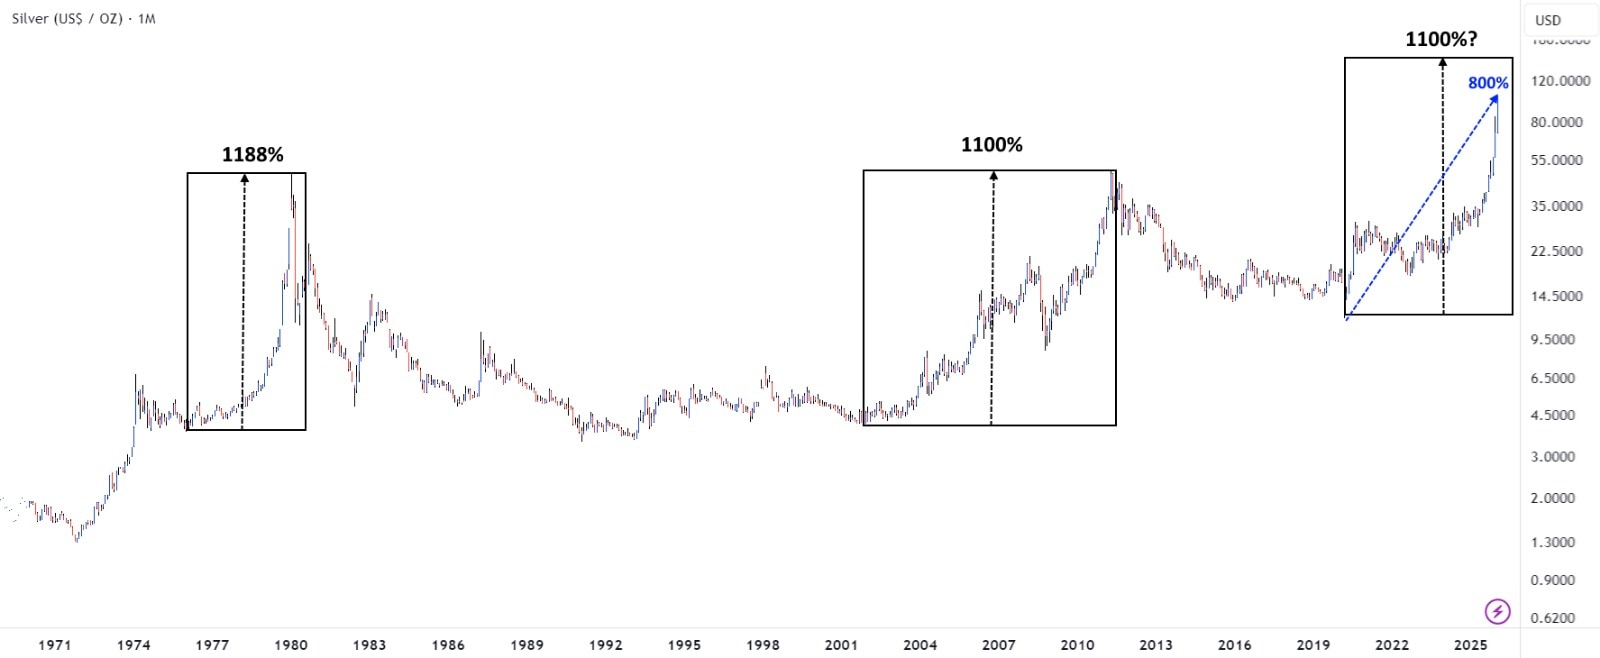
1975–1979: The Era of Inflation, Oil, and Distrust
In 1975, an ounce of silver was worth about $3.81. The Vietnam War, the end of the Bretton Woods system, and the oil shocks of the early 1970s that scarred America.
Prices for food, petrol and housing kept going up, while wages struggled. Inflation was accelerating at an alarming rate.
The US dollar. previously backed by gold, floated freely.
Investors stopped trusting paper money. Investors, families, and even businesses began searching for assets that appeared “real.” Investors liked silver more than gold because it was cheaper and easier to find.
Then there were the Hunt Brothers, who were oil tycoons and wanted to control the silver market. The economy was even more on edge because they were buying so much. By 1979, silver had shot up to almost $48, a stunning 1,188% rally.
The story didn’t end with a party, though. The party came to an end when the US Federal Reserve, led by Paul Volcker, raised interest rates sharply to stop inflation. The dollar got stronger, the economy slowed down, and silver fell. The correction after 1980 was brutal, almost 89%, and it was a painful reminder that fear often leads to profits.
2001–2011: From Dot-Com Dreams to Financial Nightmares
Fast forward to the early 2000s. The dot-com bubble had just burst around the world. There was a time when the US economy was doing well because interest rates were low, credit was easy to get, and the housing market was booming. Silver was almost forgotten at $4.15, where it sat quietly.
Then came 2008.
The financial crisis that hit the world didn’t just shake Wall Street; it also made investors lose faith in the system itself. Banks failed. The government gave money to help. The Federal Reserve started quantitative easing, which put trillions of dollars into the economy.
Investors were scared again, not just about the markets but also about money itself. Would the dollar’s value drop? Would inflation come back? Would the system be able to work?
Silver found its voice again.
Between 2001 and 2011, the price of the metal went up to about $49.83, a rally of 1,100%. This time, it wasn’t just a guess. It was for the safety of others.
Investors all over the world thought that silver could help them avoid losing money and protect themselves from economic instability. The opportunity for higher returns than safe-heaven gold was more lucrative for investors.
And once again, history repeated itself. As the US economy improved, investors trust grew, and monetary policy became stricter over time, silver lost its shine.
The correction after 2011 was deep, about 72%, but it wasn’t as bad as the crash in 1980.
A New Chapter Begins in 2020
A pandemic that spread around the world brought economies to a standstill overnight. The US government gave out big stimulus packages. Rates of interest dropped to almost nothing. The amount of money in circulation grew at a rate that hasn’t been seen in a long time.
Silver touched a low near $11.69 as the world expected everything was over for them.
What followed has been a powerful move, with the rally now nearing 800% from those lows.
The story sounds familiar as an uncertainty, aggressive monetary support, and rising concerns about debt, inflation, and the long-term value of currencies.
Let’s talk about a brave idea. If this cycle is like the last ones and goes up by 11 times, silver could probably be worth between $125 and $130. It’s not a guess. It’s the history repeating as per technical analysis.
The Other Side of the Shine
But there are always two parts to silver’s story – the rise and the fall.
History says that when silver prices go up a lot, “profit booking” becomes part of the story. The drop was almost 89% after 1980. It was around 72% after 2011. These weren’t gentle pullbacks; they were big emotional resets for investors who thought the metal could only go one way.
Liquidity – The Risk
Silver teaches this lesson to every generation that it rewards those who are patient but punishes those who are greedy.
The iShares Silver Trust (SLV) is a new chapter in the story of silver that is open to the public. It works like a mirror that shows not just the price but also how investors around the world are feeling.
iShares Silver Trust (SLV) Monthly Chart
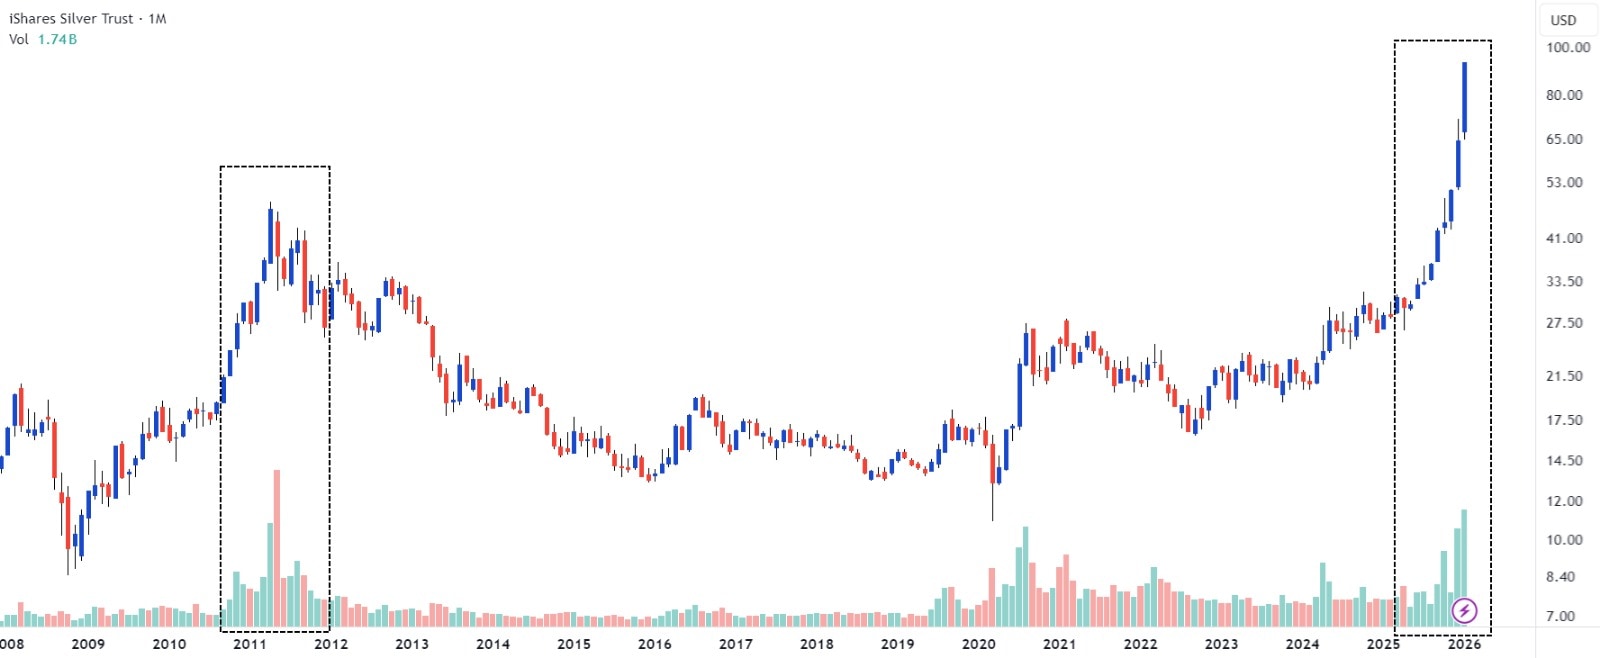
The average monthly volume went up from about 500 million to almost 1.74 billion shares in January 2026. This shows the money flow in the silver as equities are underperforming.
But this comfort is a “double-edged sword.” High volumes can mean strong conviction, but history reminds us that crowded trades often move fastest in both directions. There was a similar flurry of activity just before silver’s big drop in 2010–2011. SLV does well when people trust it, just like the metal it tracks. But when that trust starts to fade, things get riskier.
Silver doesn’t move on its own. It monitors the US economy’s “heartbeat,” which includes things like interest rates, the money supply, how many investors trust the dollar, and how much risk the world will take. Silver tends to speak up more when investors don’t trust systems anymore.
The surpass of $100 is the talk of the town for silver because global debt is rising, tensions between countries are rising, and central banks are trying to find a balance between growth and inflation.
The end of this economic story will decide whether it becomes another famous chapter or a cautionary tale.
One thing is for sure at $100, when silver starts to shine, it’s not just about the metal; it’s also about the time in history it stands for.
Disclaimer:
Note: The purpose of this article is only to share interesting charts, data points and thought-provoking opinions. It is NOT a recommendation. If you wish to consider an investment, you are strongly advised to consult your advisor. This article is strictly for educative purposes only.
Brijesh Bhatia is an Independent Research Analyst and is engaged in offering research and recommendation services with SEBI RA Number – INH000022075. He has two decades of experience in India’s financial markets as a trader and technical analyst.
Disclosure: The writer and his dependents do not hold the stocks discussed here.
The website managers, its employee(s), and contributors/writers/authors of articles have or may have an outstanding buy or sell position or holding in the securities, options on securities or other related investments of issuers and/or companies discussed therein. The content of the articles and the interpretation of data are solely the personal views of the contributors/ writers/authors. Investors must make their own investment decisions based on their specific objectives and resources, and only after consulting such independent advisors if necessary.