

If things seem too good to be true on Wall Street, history shows they probably are.
For the better part of the last 16 years, the U.S. stock market has been unstoppable. Outside of the COVID-19 crash, which lasted five weeks, and the 2022 bear market that endured about nine months, investors have been basking in long-lasting bull markets.
This year, we’ve witnessed the broad-based S&P 500 (^GSPC +0.54%), growth-propelled Nasdaq Composite (^IXIC +0.65%), and iconic Dow Jones Industrial Average (^DJI +0.61%) all rally to several record highs. These gains have been fueled by the evolution of artificial intelligence, the expectation of future rate cuts by the Federal Reserve — lower interest rates make it less costly for businesses to borrow, which can act as a catalyst for hiring, innovation, and merger and acquisition activity — and better-than-expected corporate earnings.
While the sky may be the limit for stocks, history provides two differing perspectives. Although stocks have delivered the highest average annual return of any asset class over the last century, these gains aren’t achieved without hiccups along the way.
As the S&P 500, Nasdaq Composite, and Dow Jones Industrial Average have climbed to never-before-seen levels, stock valuations are attempting to follow suit.
Image source: Getty Images.
Wall Street appears set to enter the new year with the second priciest stock market on record — and history offers investors a dire warning of what’s to come.
The stock market has only been pricier on one occasion since 1871
Before going any further, let’s add an important qualifier. There isn’t a data point, indicator, or correlated event that can guarantee what an individual stock or a stock market index is going to do over the short term. If something like this existed, you could rest assured that every investor would be using it to predict the future.
Nevertheless, history does have a way of rhyming on Wall Street. Select correlated events throughout history have exceptional track records of foreshadowing what’s to come for the S&P 500, Nasdaq Composite, and Dow Jones Industrial Average.
Typically, valuation is entirely subjective. What you find to be pricey might be viewed as a bargain by another investor. Every investor has their own unique process of evaluating stocks, which is what leads to an unpredictable market.
But there’s one valuation measure that leaves little room for argument: the S&P 500’s Shiller Price-to-Earnings (P/E) Ratio, which is also referred to as the cyclically adjusted P/E Ratio (CAPE Ratio).
What makes the Shiller P/E so valuable from an evaluation standpoint is that it’s based on average inflation-adjusted earnings over the prior 10-year period. Whereas the traditional P/E ratio, based on trailing 12-month earnings per share, can be easily disrupted by shock events and economic downturns, the Shiller P/E remains useful during these events.
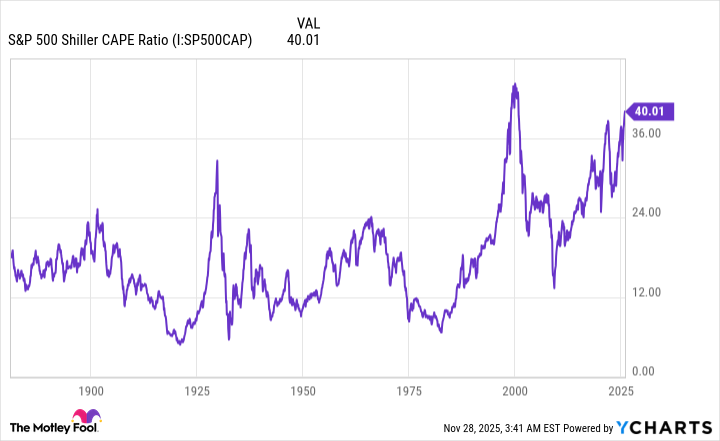
S&P 500 Shiller CAPE Ratio data by YCharts.
Though the Shiller P/E wasn’t officially introduced until the late 1980s, it’s been back-tested to January 1871. Over this nearly 155-year period, the average multiple is 17.31.
But as you’ll likely notice from the chart above, the S&P 500’s Shiller P/E has spent much of the last 30 years above this roughly 155-year average. This has to do with the mainstream proliferation of the internet breaking down information barriers that had previously existed between Wall Street and Main Street in the mid-1990s. Additionally, interest rates declined to historic lows in the 2010s and early 2020s, which encouraged investors to put their money to work in growth stocks.
As of the closing bell on Nov. 26, the S&P 500’s Shiller P/E was 40.20, which is a stone’s throw from the late October peak of 41.20 for the current bull market. This is only the third time since 1871 that we’ve observed the Shiller P/E crest 40 — it peaked at 44.19 in December 1999 and topped out a few hundredths above 40 just prior to the 2022 bear market taking shape — and the sixth time in almost 155 years that it’s surpassed 30 during a continuous bull market. This is where historical precedent comes into play.
Following the previous five instances where the Shiller P/E topped 30, the S&P 500, Nasdaq Composite, and/or Dow Jones Industrial Average all declined by 20% to 89%. While the 89% drop is somewhat of an outlier for the Dow during the depths of the Great Depression, the S&P 500 and Nasdaq did plunge 49% and 78%, respectively, after the dot-com bubble burst.
Based solely on what history tells us, it’s not a matter of “if” but “when” Wall Street’s major stock indexes endure an elevator-down move.

Image source: Getty Images.
Moments of panic on Wall Street can yield generational buying opportunities for patient investors
Most investors aren’t keen on the idea of the S&P 500, Nasdaq Composite, and Dow Jones Industrial Average losing 20% or more of their value. With emotions often leading the way when red arrows rule the roost, it’s not uncommon for these moves lower to occur quickly (i.e., elevator-down declines).
However, bear markets and stock market crashes have the potential to yield generational buying opportunities for investors with a long-term mindset.
As I pointed out earlier, getting from Point A to B on Wall Street doesn’t happen in a straight line. Stock market corrections, bear markets, and even feared crash events are normal, healthy, and inevitable aspects of the investing cycle. No amount of action taken by the Federal Reserve or U.S. government can keep equities from experiencing these events from time to time.
But there’s a marked disparity between the average length of downturns on Wall Street and bull markets.
In June 2023, with the S&P 500 officially entering a new bull market, the researchers at Bespoke Investment Group published a data set on X (formerly Twitter) that compared the length of every S&P 500 bull and bear market between the start of the Great Depression (September 1929) and June 2023.
It’s official. A new bull market is confirmed.
The S&P 500 is now up 20% from its 10/12/22 closing low. The prior bear market saw the index fall 25.4% over 282 days.
Read more at https://t.co/H4p1RcpfIn. pic.twitter.com/tnRz1wdonp
— Bespoke (@bespokeinvest) June 8, 2023
On one end of the spectrum, the average bear market for the S&P 500 resolved in 286 calendar days, equivalent to about 9.5 months. Furthermore, none of the 27 documented bear markets during this period endured longer than 630 calendar days.
In comparison, the typical S&P 500 bull market has persisted for 1,011 calendar days, or approximately 3.5 times longer than the average bear market. Additionally, roughly half of all S&P 500 bull markets have lasted longer than the lengthiest bear market since the Great Depression.
Although there’s no way to know ahead of time when a stock market downturn will begin, how long it’ll last, or where the bottom will be, history demonstrates the clear benefit of pouncing during sizable stock market declines and trusting in time as an ally.