

China’s imports in the first seven months of 2025 reveal shifting demand across energy commodities, high-tech inputs, and consumer goods. For global exporters and investors, the data provides insights into where new opportunities are emerging, how supply chains are realigning, and what strategies can help capture growth in China’s evolving market.
China’s import patterns are a vital barometer for global businesses. They reveal not only the state of domestic demand but also how China is positioning itself within international supply chains. For companies selling into the Chinese market or relying on China’s role in global production, shifts in imports provide early signals of emerging opportunities, policy shifts, and risks to watch.
Find Business Support
Between January and July 2025, China imported goods worth around US$1.45 trillion, according to the General Administration of Customs (GACC). The data shows both short-term fluctuations and long-term adjustments across key sectors. Imports of energy and raw materials remained substantial, technology-related goods such as semiconductors continued to dominate, and consumer-oriented products from automobiles to cosmetics showed resilience despite a cautious macroeconomic backdrop. At the same time, changes in China’s sourcing, with stronger growth from ASEAN and Belt and Road Initiative (BRI) partners, underscore evolving trade dynamics.
This article examines China’s import landscape from January to July 2025 across four key areas and concludes with insights for foreign businesses, highlighting where demand is shifting and how exporters and investors can position themselves in China’s changing market.
Start exploring
General import performance and monthly trends
In the first seven months of 2025, China’s goods imports reached RMB 10.39 trillion (US$1.45 trillion), a year-on-year decline of 1.6 percent. While headline growth was slightly negative, underlying demand showed resilience. Supportive policies targeting industrial upgrading and domestic consumption helped stabilize imports, with momentum shifting to positive growth in the second quarter. Notably, imports of petrochemicals, textiles, machinery, and other equipment recorded double-digit growth, while electronic components and other critical inputs expanded at a faster pace. Meanwhile, inbound shipments of crude oil, metal ore, and other key raw materials also increased in volume terms.
Commodity price fluctuations weighed heavily on the value of imports. As a major commodity importer—commodities account for about 30 percent of China’s total imports—China’s figures are highly sensitive to price shifts. In the first half of 2025, the average import prices of crude oil, iron ore, and soybeans fell by more than 10 percent year-on-year, dragging overall import growth down by an estimated 2.7 percentage points. This divergence underscores the need to look beyond import values and track physical volumes, which points to genuine growth in demand.
Industrial and consumer demand both contributed to the second quarter’s rebound. Steady industrial production supported stronger imports of equipment and parts, with high-end machine tools and electronic components seeing significantly faster growth than in the first quarter. At the same time, recovering market sales drove up demand for certain consumer goods. With government incentives such as “old-for-new” consumption policies, retail sales growth accelerated in the first half of the year, leading to higher imports of food and beverages (up 8.8 percent year-on-year), cultural and entertainment products (up 10.8 percent), and daily chemical goods (up 3.1 percent).
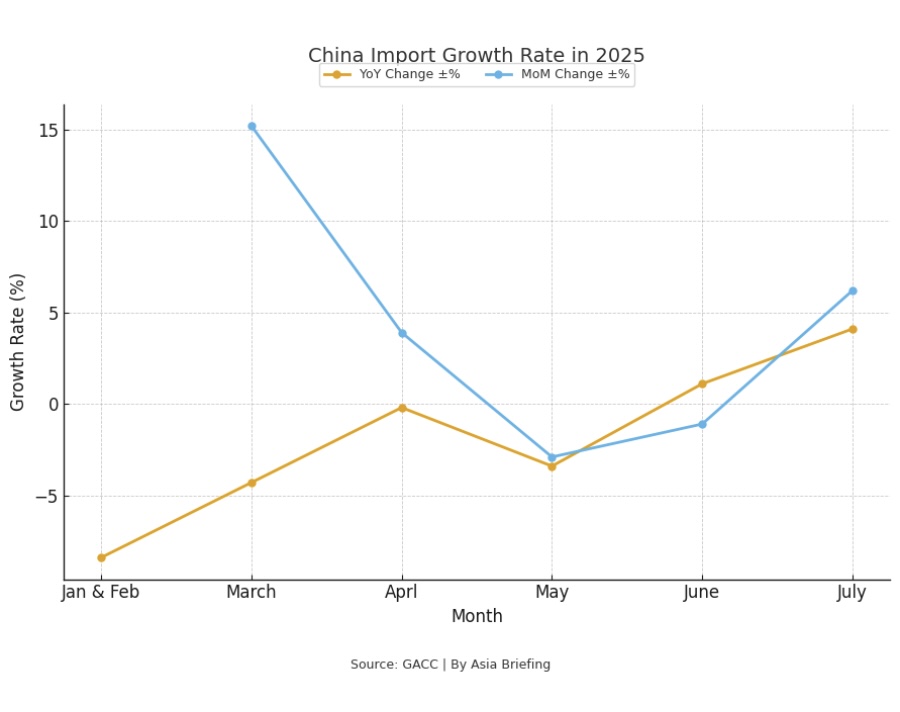
On a monthly basis, import activity reflected both seasonal and structural dynamics. Imports in the first two months totaled US$369 billion, down 8.4 percent year-on-year, due to the Chinese New Year slowdown and softer consumer demand. March saw a rebound to US$211 billion, narrowing the decline to 4.3 percent year-on-year and rising 15.2 percent month-on-month, as raw materials restocking and a rebound in commodity prices.
April imports remained steady at US$219 billion, nearly flat year-over-year, before softening in May and June amid easing energy prices and weaker demand in certain industrial sectors. By July, imports recovered to US$224 billion, up 4.1 percent year-on-year, supported by higher crude oil and semiconductor inflows, as well as early signs of recovery in consumer goods.
For global businesses, the data suggests that while industrial demand remains cyclical and tied to global prices, opportunities are emerging in consumer-driven imports, signaling a gradual pivot toward household demand as a more stable growth driver.
Imports by key trading partners
Between January and July 2025, China’s imports from major trading partners also showed notable shifts. BRI countries remained the largest supplier, with imports totaling around US$772 billion, reflecting the strength of policy-driven trade links. ASEAN followed as the second-largest partner at US$220 billion, underscoring its role as a hub for electronics, machinery, and intermediate goods, as regional production networks deepen under China’s “dual circulation” strategy. Imports from the European Union (EU) reached US$149 billion, relatively stable compared to ASEAN’s faster growth.
Within Asia, South Korea (US$102 billion) and Japan (US$89 billion) continued to supply critical high-tech components, though their shares have plateaued rather than expanded. Imports from the United States (US) stood at US$86 billion, with fluctuations linked to agricultural commodities and technology, partly constrained by trade tensions and tariff measures. Inside ASEAN, Vietnam contributed more than US$50 billion, highlighting its rising position as a manufacturing and re-export base for China.
Beneath these headline figures, sectoral trade flows highlight important opportunities. From the EU, imports of automotive parts surged, with transmissions for large buses up 40.8 percent and diesel engines up 65.2 percent in the first half of 2025. Consumer goods trade also deepened: the EU was China’s largest source of imported healthcare products, bags, and jewelry, each accounting for more than 60 percent of China’s imports in those categories.
Meanwhile, imports from other BRICS partners showed diversification in both industrial and consumer goods. China increased purchases of printed circuit boards and components for automatic data processing equipment, as well as rubber and plastics. In agricultural products, imports of palm oil and rapeseed oil rose 13.7 percent, while edible seafood such as shrimp and crab increased 10.6 percent.
For global exporters, these trends suggest that growth opportunities are strongest in ASEAN, BRI, and BRICS markets, where policy alignment and supply chain complementarities are driving deeper integration. Trade with traditional partners such as the EU, US, Japan, and South Korea remains significant, but their expansion has been slower and more vulnerable to geopolitical headwinds.
Read also: How 2025 Tariffs Are Changing China’s Export Landscape
Imports by major product categories
Between January and July 2025, integrated circuits remained the single largest import item at approximately US$228 billion, reflecting China’s continued reliance on overseas supplies of semiconductors despite ongoing domestic capacity expansion. Imports of crude oil followed at US$171 billion, underscoring both sustained industrial demand and precautionary stockpiling amid global price volatility. Technology-related imports such as automatic data processing equipment and parts related reached around US$56 billion, underlining persistent demand for computing hardware.
Agricultural and resource commodities also played a significant role. Cereals and natural gas each totaled US$32 billion in imports, while soybeans reached US$27 billion as a vital input for China’s food and feed sectors. Coal imports stood at US$19 billion, helping meet energy needs during periods of peak consumption.
On the consumer side, automobiles (US$14 billion) and meat products (US$14 billion) maintained solid inflows, reflecting steady household demand even against a cautious macroeconomic backdrop. Cosmetics and personal care goods, valued at US$10 billion, continued to grow, supported by shifting consumption patterns toward premium products and rising demand among younger urban consumers.
Overall, these figures highlight the dual structure of China’s import demand. Industrial and energy-related goods still dominate by value, but consumer-oriented categories are steadily growing in importance, pointing to household demand as an increasingly influential driver of China’s trade profile.
Imports by trading method
Between January and July 2025, general trade accounted for the majority of China’s imports, totaling around US$880 billion. This dominance reflects a structural shift, with imports increasingly tied to direct domestic consumption and industrial demand rather than re-export processing. By contrast, processing trade with imported materials contributed about US$192 billion, while processing and assembly trade with supplied materials added US$53 billion, both reflecting a smaller share of overall imports, underscoring China’s gradual move away from its traditional role as a global processing hub.
Imports under customs supervision zones also remained significant. Goods handled through logistics in such zones reached about US$184 billion, while bonded supervision premises imports contributed nearly US$118 billion.
At the same time, new trade formats are expanding. In the first half of 2025, China’s cross-border e-commerce imports and exports reached RMB 1.32 trillion (US$182 billion), up 5.7 percent year-on-year. Of this, imports accounted for RMB 291.1 billion (US$40 billion), growing 9.3 percent, faster than exports, highlighting rising consumer appetite for overseas goods purchased via online platforms.
Taken together, the growing share of general trade and e-commerce imports signals a long-term reorientation of China’s external trade model toward domestic demand. For foreign companies, this creates broader opportunities in household and industrial sectors, but also demands more localized strategies, stronger consumer engagement, and agile participation in digital trade channels.
Implications for global businesses
China’s import trends in 2025 underline a deeper shift in how foreign companies should approach the market. Rather than reading the figures only as snapshots of demand, businesses need to interpret them as signals of China’s evolving economic priorities and structural adjustments.
Find Business Support
Three strategic implications stand out. First, the persistence of high-tech and advanced manufacturing imports shows that even as China accelerates domestic substitution, foreign suppliers of critical technologies and components will remain embedded in supply chains—though success will increasingly depend on aligning with policy priorities and forming local partnerships. Second, the steady rise of consumer-oriented imports points to household demand becoming a more reliable growth driver. Companies targeting premium and lifestyle segments, particularly through cross-border e-commerce and digital retail channels, will be best positioned to capture this shift. Third, the growing weight of ASEAN and Belt and Road economies in China’s sourcing patterns suggests that competitive advantage will depend on positioning within regional value chains, not just selling directly into China.
Risks remain—localization pressures, geopolitical frictions, and price volatility in commodities could all reshape sourcing and competitiveness. Yet for firms that adapt, these challenges can be turned into resilience strategies—by diversifying supply chains, investing in China-based customization, and leveraging regional hubs to meet Chinese demand more flexibly.
Looking ahead, the most promising opportunities lie where structural demand intersects with policy support: semiconductors and advanced machinery tied to industrial upgrading, and consumer goods linked to rising urban incomes. For global businesses, success will hinge less on chasing short-term trade fluctuations and more on embedding strategies that anticipate China’s long-term pivot toward innovation-driven industry and consumer-led growth.
About Us
China Briefing is one of five regional Asia Briefing publications, supported by Dezan Shira & Associates. For a complimentary subscription to China Briefing’s content products, please click here.
Dezan Shira & Associates assists foreign investors into China and has done so since 1992 through offices in Beijing, Tianjin, Dalian, Qingdao, Shanghai, Hangzhou, Ningbo, Suzhou, Guangzhou, Haikou, Zhongshan, Shenzhen, and Hong Kong. We also have offices in Vietnam, Indonesia, Singapore, United States, Germany, Italy, India, and Dubai (UAE) and partner firms assisting foreign investors in The Philippines, Malaysia, Thailand, Bangladesh, and Australia. For assistance in China, please contact the firm at china@dezshira.com or visit our website at www.dezshira.com.