

- Gold price drops toward $3,350 after facing rejection again above $3,400 on Monday.
- The US Dollar consolidates the downside as focus shifts to US CPI data and US-China tariff deadline.
- Gold price looks to retest $3,355-$3,350 confluence support as profit-taking intensifies.
Gold price is falling toward $3,350 early Monday, replicating the bearish moves seen in Friday’s Asian trades as $3,400 remains a tough nut to crack for buyers.
Gold keenly awaits US inflation report, US-China trade talks
Risk flows extend into Asia at the start of the week on Monday as traders remain hopeful that the US-China August 12 tariff deadline will be extended, averting imposition of higher levies.
Further, markets also expect that the US and China could strike a deal around chip policy, especially after the Financial Times (FT) report on Sunday that American “chip manufacturers Nvidia and AMD agreed to allocate 15% of their revenues from sales in China to the US government under an arrangement to obtain export licences for the semiconductors.”
Additionally, there is optimism around a likely meeting between US President Donald and Russian President Vladimir Putin on August 15 in Alaska to negotiate an end to the war in Ukraine.
These factors contribute to the risk-on market environment, as of writing, diminishing Gold price demand as a safe-haven asset.
Meanwhile, Gold price also takes a hit due to the persistent factory-gate deflation in China. While consumer prices in the country have remained stable, the Producer Price Index (PPI) in July fell 3.6%, surpassing the forecast of a 3.3% decline. Note that China is the world’s top Gold consumer.
The latest leg down in Gold could also be sponsored by profit-taking as traders reposition themselves ahead of Tuesday’s critical Consumer Price Index (CPI) inflation data.
However, the Gold price downside could remain capped amid increased dovish expectations surrounding the Federal Reserve (Fed) interest-rate cuts, following a slew of downbeat US economic data and tariffs in effect.
At a speech during a bankers’ conference in Colorado on Saturday, Fed Governor Michelle Bowman, one of two Fed dissenters, said that “the latest labor market data reinforce my view” that the Fed should cut interest rates three times this year.
Concerns over the Fed appointments and its independence could also remain supportive of the bright metal.
Gold price technical analysis: Daily chart
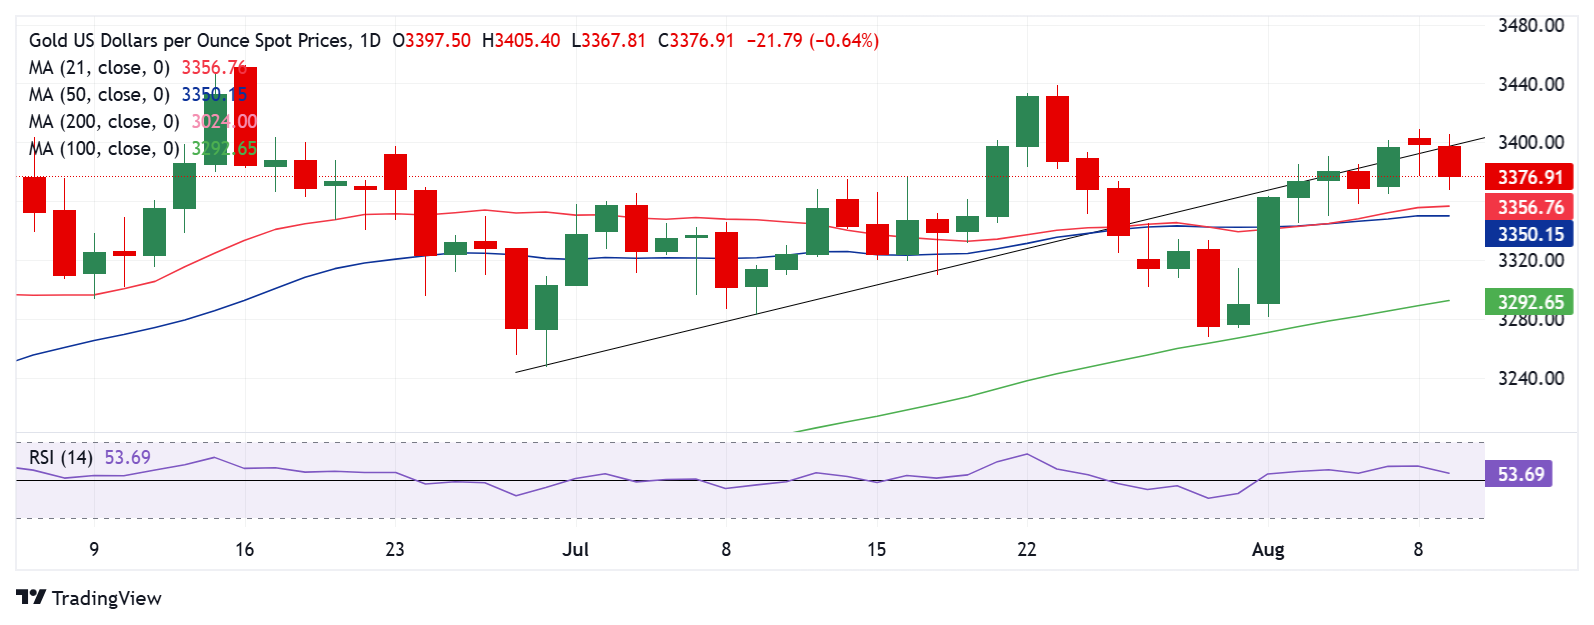
Despite closing the previous week above the rising trendline support-turned-resistance, then at $3,395, Gold sellers retained control starting out a new week.
However, with the 14-day Relative Strength Index (RSI) still defending the midline and the Bull Cross in play, any downside will likely be quickly bought into.
Strong support is aligned at the 21-day SMA and 50-day SMA confluence in the range of $3,355 and $3,350. Acceptance below that level will unleash additional downside toward the $3,300 round figure. Deeper declines will challenge the 100-day SMA at $3,289.
In case Gold price finds acceptance above the rising trendline support-turned-resistance, now at $3.400, a fresh leg higher toward the $3,440 static hurdle and the June 16 high of $3,453 cannot be ruled out.
The record high of $3,500 will be next on buyers’ radars.
Economic Indicator
Consumer Price Index (YoY)
Inflationary or deflationary tendencies are measured by periodically summing the prices of a basket of representative goods and services and presenting the data as The Consumer Price Index (CPI). CPI data is compiled on a monthly basis and released by the US Department of Labor Statistics. The YoY reading compares the prices of goods in the reference month to the same month a year earlier.The CPI is a key indicator to measure inflation and changes in purchasing trends. Generally speaking, a high reading is seen as bullish for the US Dollar (USD), while a low reading is seen as bearish.